The Andon board: the benefits of having essential information visible to everyone
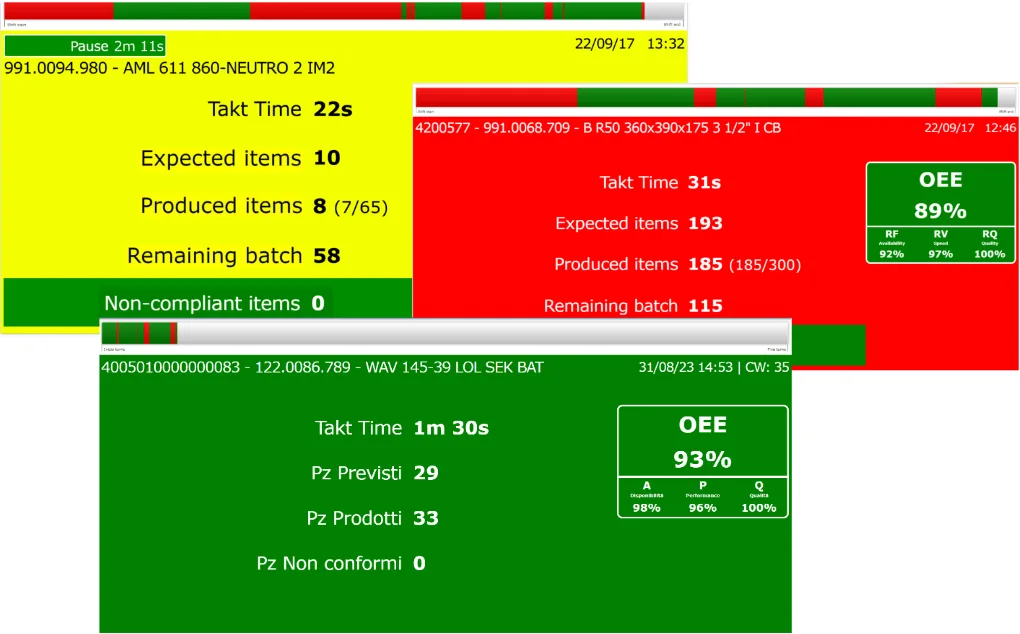
"The Andon board is a large monitor (ranging from 55'' to 75'' or more) that is typically located near each production line. Its purpose is to display the production progress to everyone, including operators and plant managers, through a few but essential pieces of information:
- Takt time
- Expected parts
- Parts actually produced
- Non-conforming parts
- Good parts on the first try
- The percentages of availability, performance, and quality, and therefore the current OEE (Overall Equipment Efficiency)
"Other information can also be integrated, such as the display of time (time bar) during which the machine was actually available and the amount of time during which there were downtimes.
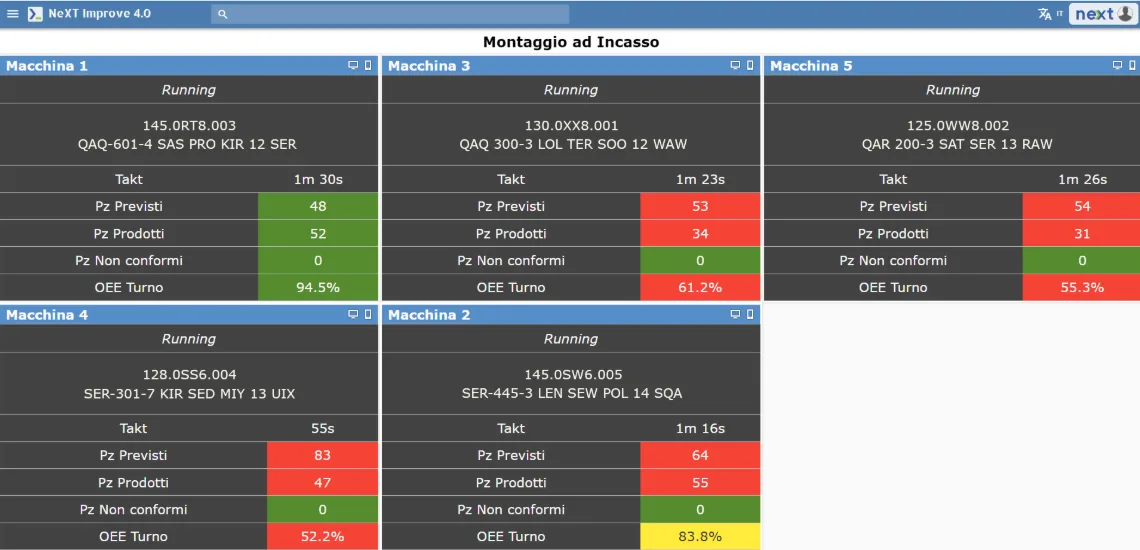
Production Data
The Andon boards display the main production data.
The different background colors provide an immediate perception of the production progress, as they are associated with different OEE percentage ranges..
Aggregated Data
The information flows into different dashboards,, dedicated to different roles and tasks.
One dashboard is dedicated to showing aggregated data regarding all the lines, providing an overview of the department. It is then possible to drill down into the details of each individual line.