Skip to content
Data Acquisition
Data Acquisition

Data acquisition

The acquisition of production data is essential to obtain detailed and relevant information to optimize productivity.

Request a demo

Data acquisition is one of the most advanced features of IMPROVE

Collecting a vast amount of data (variables, parameters, etc.) directly from the field provides a solid foundation for improving business processes and supporting the training of Deep Learning models, thus ensuring predictive analysis and more informed decision-making.

What will you achieve?

The highest level of knowledge

What will you gain?

An increase in productivity

What and how: the smartest way to improve

What?

  • Parameter Configuration: Define acceptable deviations for each variable, clearly and precisely establishing "Out of Control" limits.
  • Data Acquisition: Collect data directly from the field, either through the PLC or manually by operators.
  • Data Analysis: Analyze the data using statistical techniques and visual reports to simplify information, avoiding the risk of overload and facilitating quick decision-making.

How?

Internet of Things (IoT) and Data Acquisition

  • The Sources: IoT devices, such as sensors and PLCs, collect real-time data, which is then analyzed by software agents in the IMPROVE system. It is also possible to use data from other existing datasets.
  • Software Agents: Software agents are essential in data acquisition and analysis: they collect data from the PLCs, monitor the status of variables, and compare data with preconfigured values to detect anomalies and trigger automatic corrective actions.
  • Statistical Process Control and Data Analysis: IMPROVE employs advanced data analysis tools, such as Statistical Process Control (SPC), to optimize operations, including trend analysis, statistics, process capability (Cp, Cpk), histograms, and Gaussian distribution.

Detailed reports and graphs for statistical control

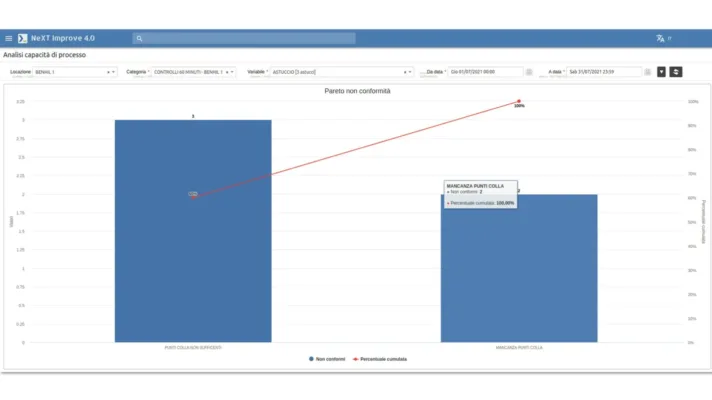
The results obtained from the analysis phase are presented in a series of comprehensive reports, with data organized in both tabular and visual formats. These reports are derived directly from the statistical process control, offering a clear and in-depth overview of performance.

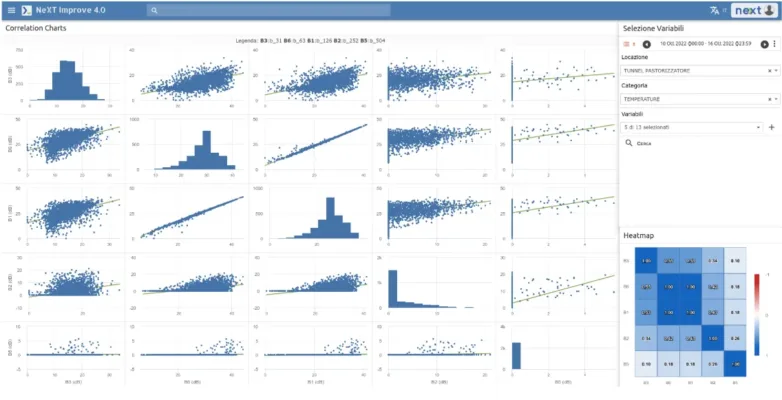
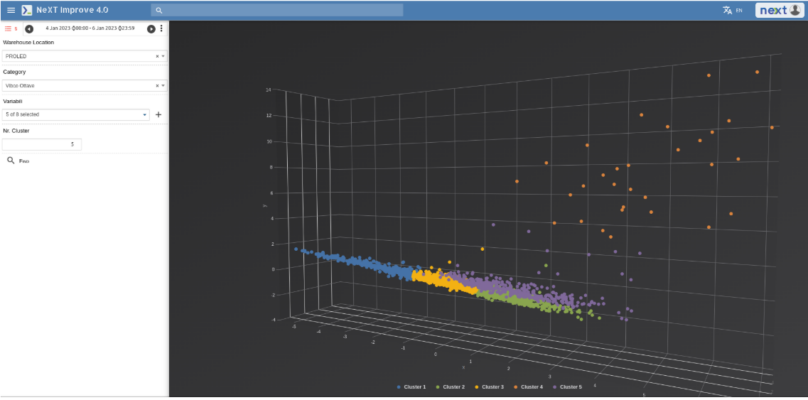
The graphs used in the reports are of various types, including: frequency histograms, Gaussian distribution analysis, Pareto charts, process capability, and multivariate analysis. The latter allows for the examination of correlations between variables to optimize and improve the process as a whole.

Ready to improve
your processes?

Every small change, if done with awareness, can have a big impact.

Request a demo