The ideal solution for the manager: Full control in just a few minutes.
In just a few minutes of the daily routine, the manager can get a complete view of all activities in the plant.
Thanks to data, alerts, charts, and tables, Digital Shopfloor Management (DSM) helps make strategic decisions for continuous improvement and optimization of operations across various aspects of the production process.
The three phases of Digital Shopfloor Management


The 5 thematic areas of Digital Shopfloor Management
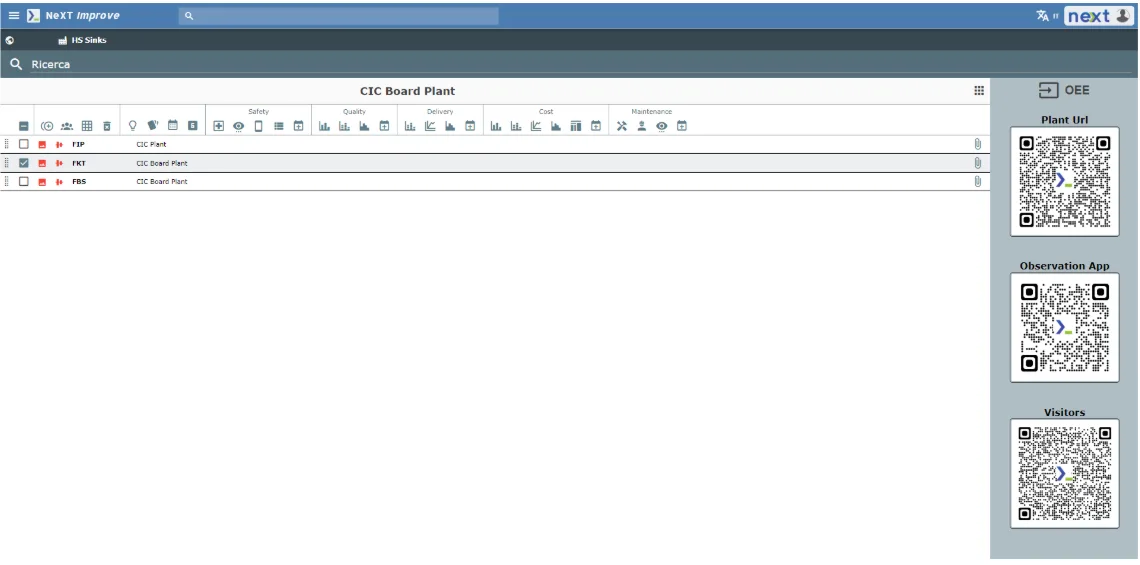
"Digital Shopfloor Management (DSM) monitors 5 main areas: Safety, Quality, Delivery, Cost, and Maintenance. For each area, it is possible to view the main KPIs in a concise manner, facilitating improvement decisions, the creation of action plans, team formation, and the evaluation of results over time.
These areas are monitored both at the plant level and at the individual department and production line levels. Each area defines targeted action plans with specific durations and deadlines to resolve issues.
In detail, the 5 thematic areas are:
Safety
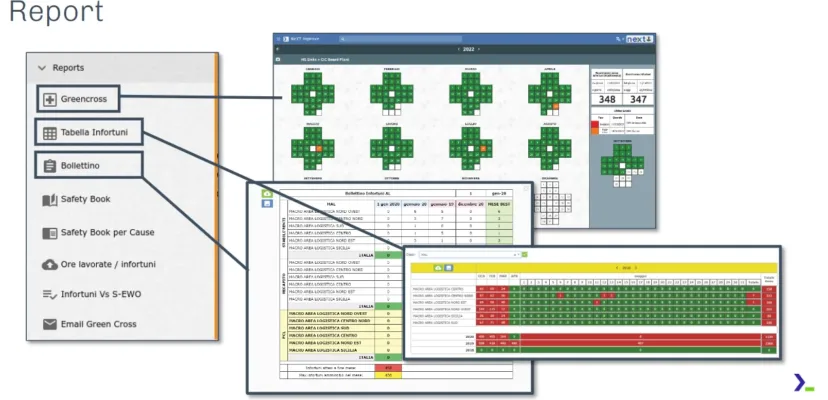
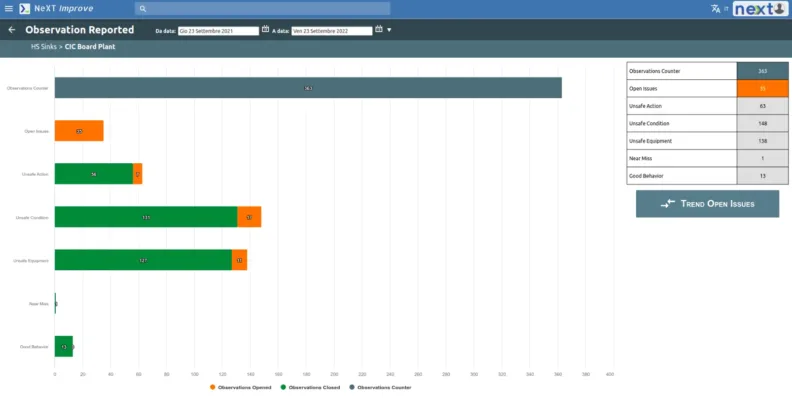
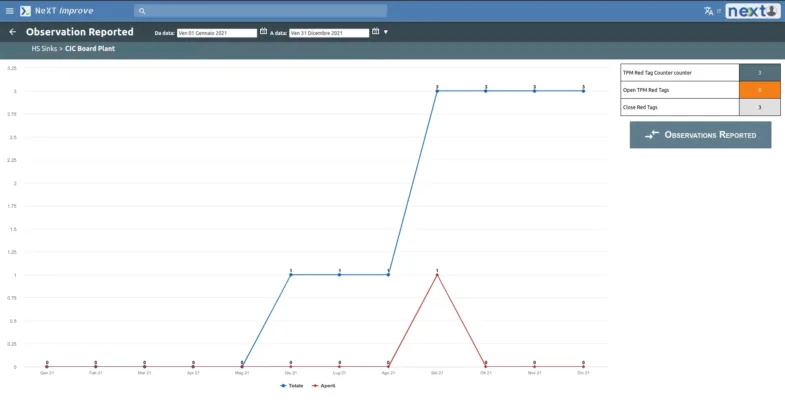
The goal is to reduce accidents and create a safe working environment. The action plan includes theJob Safety Observation Action, which allows reporting of incidents, near misses, or hazardous situations via smartphone.
Each report generates an action plan managed by a team and a responsible person. All information on reports and solutions is visible through visual reports.
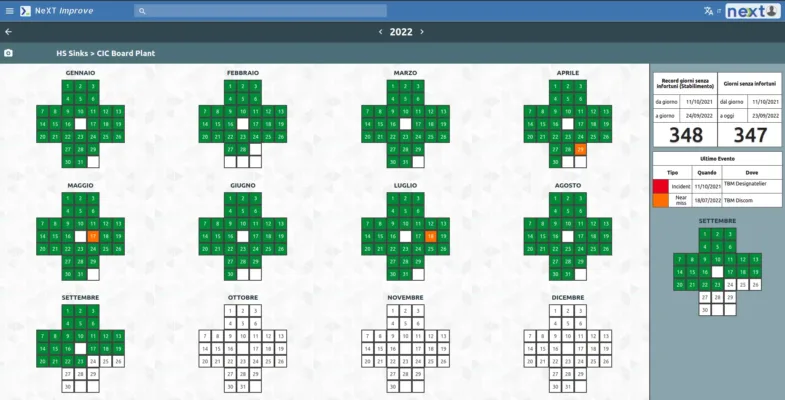
Green Cross chart monitors workplace injuries and critical issues in departments.
Additionally, it is possible to schedule and monitor 6S Audit (Sort, Set in Order, Shine, Standardize, Sustain, Safety) to ensure continuous improvement in safety.
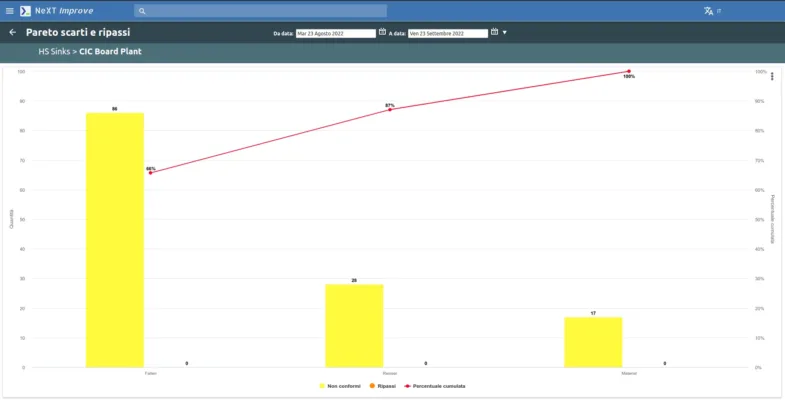
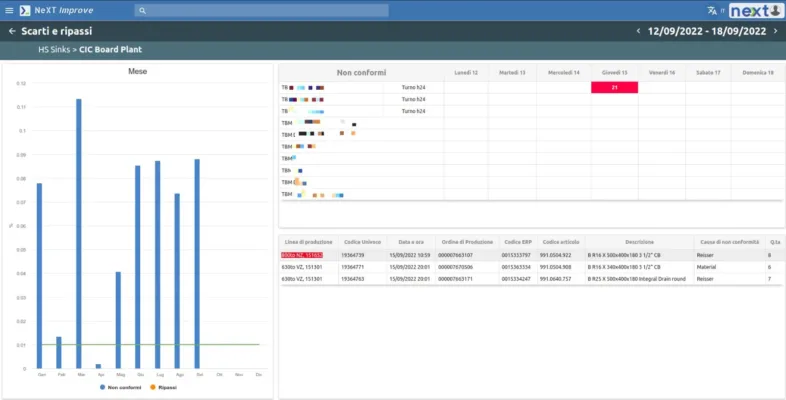
Quality
Each quality issue generates an action plan assigned to a responsible person with the suggested countermeasure.The quality area integrates with the OEE System to monitor efficiency, producing graphs on scrap and rework organized by month and week.
It is possible to set an acceptable scrap threshold and view data at the plant or department level. Additionally, Pareto charts highlight non-conformities and their main causes.
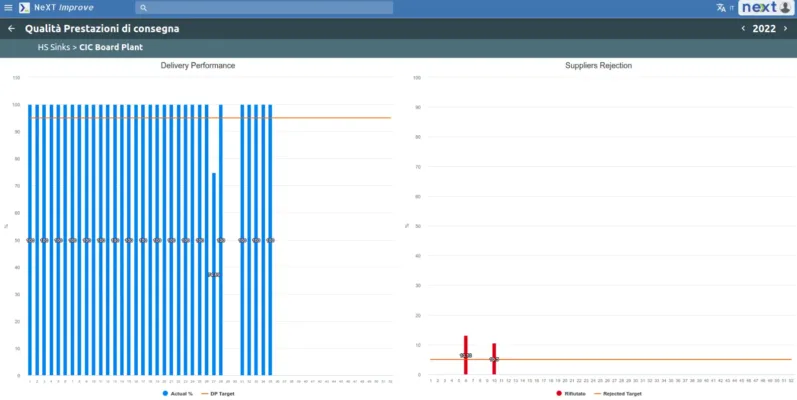
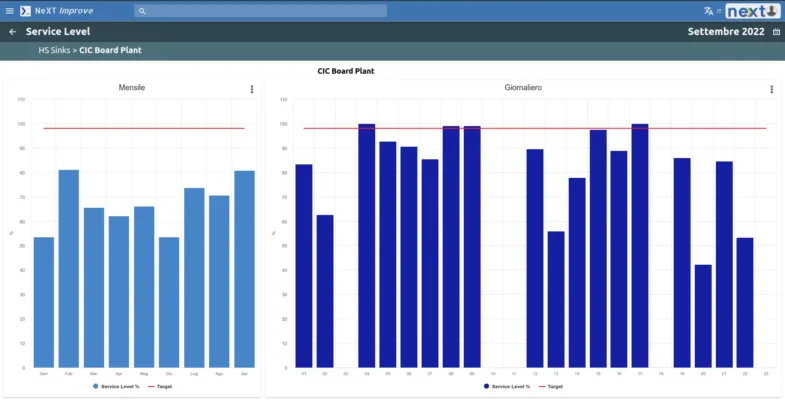
Delivery
The Delivery area focuses on service level anddelivery times to customer.
Productivity is monitored, tracking on-time and delayed deliveries. It is possible to set a minimum productivity threshold and analyze the causes of missed productivity through a Pareto chart.
Additionally,inventory is monitored, with data onraw materials, semi-finished goods and work-in-progress goodsin lavorazione.
Cost
The goal of the Cost area is toidentify and reduce waste, analyzing production efficiency, downtime (machine stops and setup times), delivery times from the lines to the warehouse, and theactual productivity of the plant and departments.
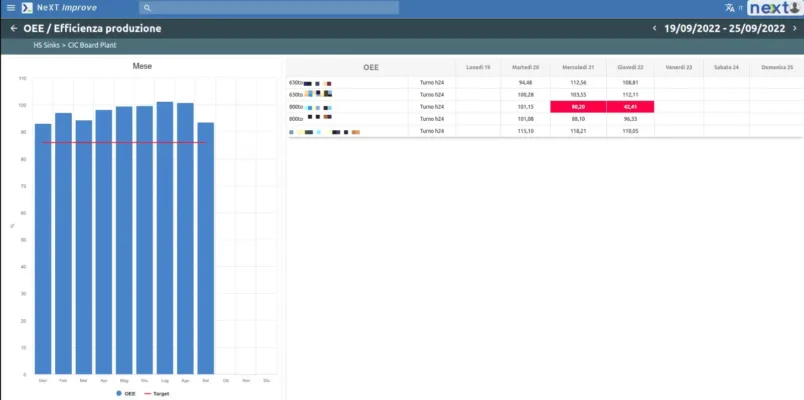
The area integrates with the OEE System, which provides data onefficiency, machine downtime and production changeover times (tooling). Efficiency data is collected weekly or monthly and divided by plant, department, or shift.
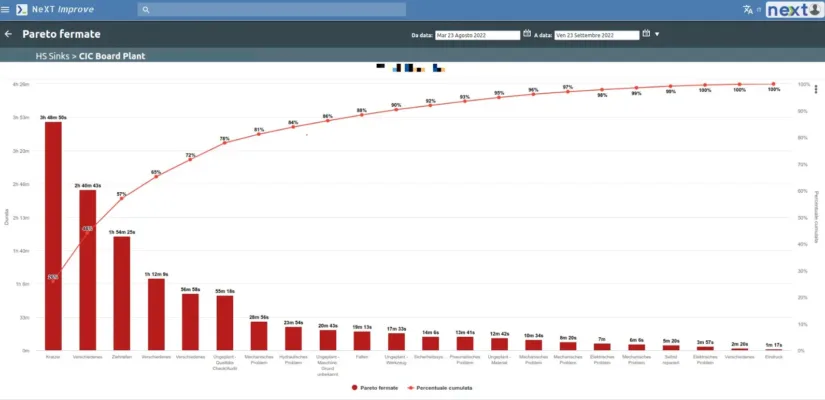
The causes of machine downtime are analyzed through a Pareto chart, and a threshold can be set for setup times, monitoring progress against objectives. Additionally, delivery times and actual productivity are compared with the desired ones.
Maintenance
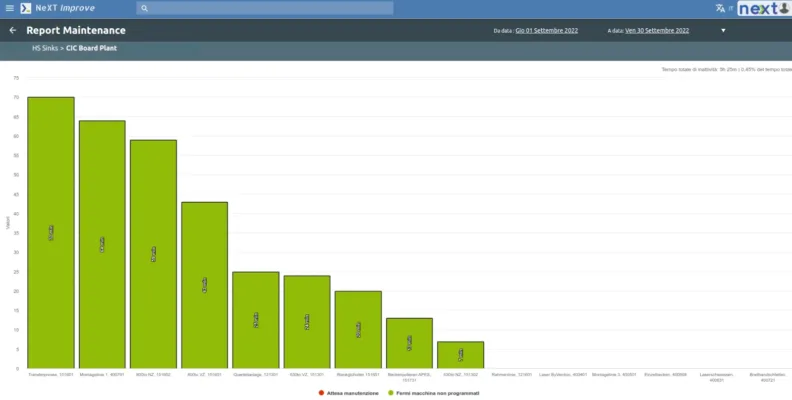
The goal of the Maintenance area is to minimize unexpected machine downtimes, monitoring the main causes and allowing maintenance issues to be reported via a mobile device.
The main causes of downtime are displayed through a histogram, correlating downtimes with inactivity times. Additionally, as in the Safety area, it is possible to consult a report of the reports, analyzing the difference between open and closed reports.
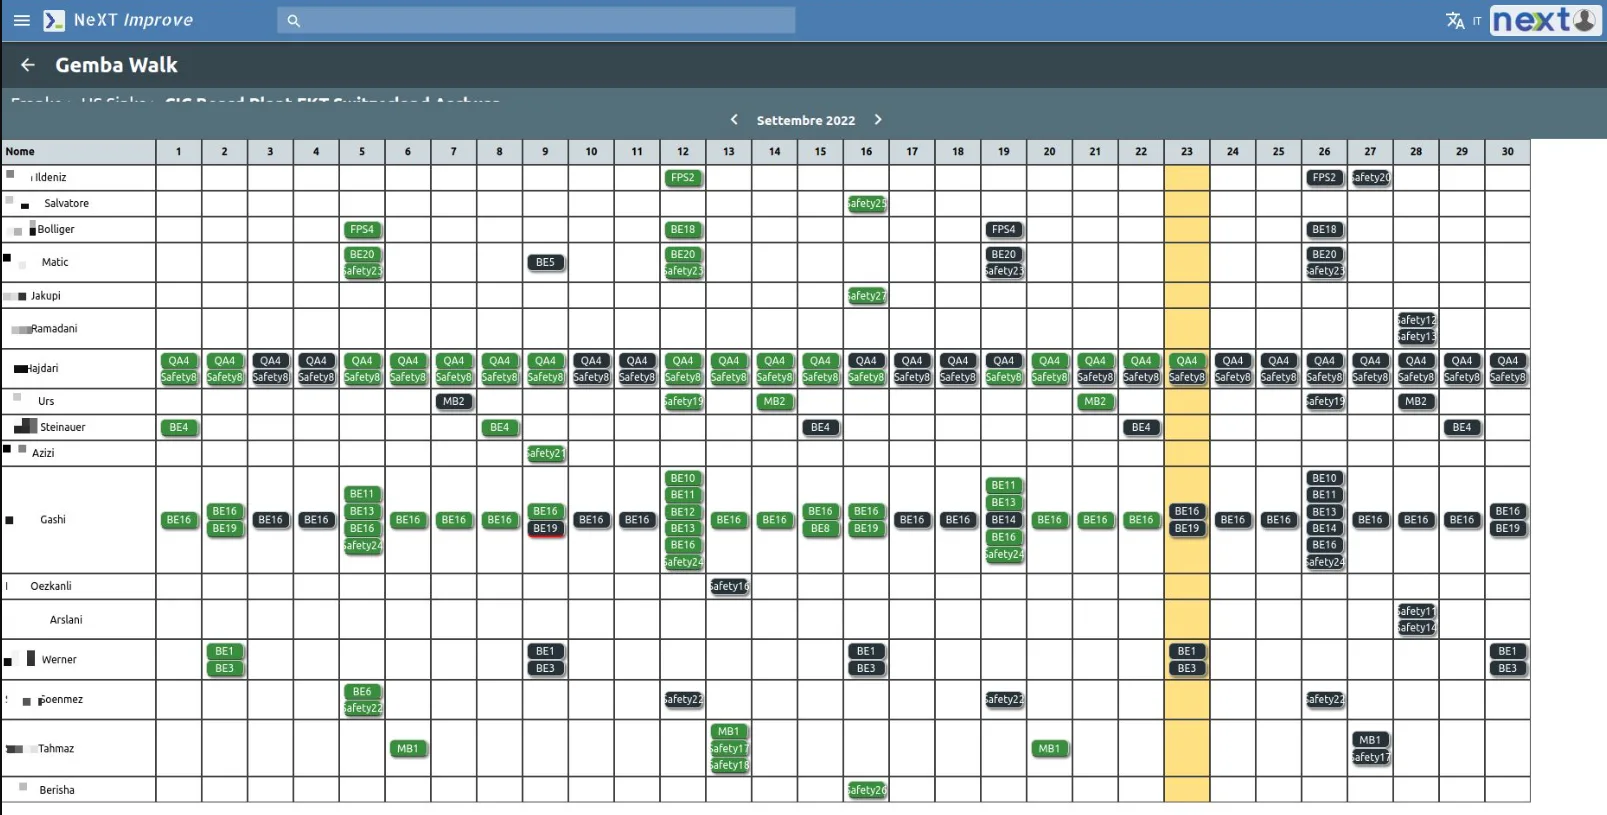
The Gemba Walk in Lean Production: Observing to improve value
The Gemba Walk in Lean Production is the moment when managers leave their desks to go directly to where value is created. The goal is to observe, interact, and understand the processes, focusing on improvement rather than individuals, in order to identify inefficiencies (MUDA) and optimize the production flow.
In Digital Shopfloor Management, the Gemba Walk is conducted through a mobile device with a calendar and specific Cards for each of the 5 thematic areas: Safety, Quality, Delivery, Cost, and Maintenance.
Each card includes a responsible person and a team, a frequency (e.g., 'once a week'), and a time duration (e.g., 'for 3 months'). The aim is to verify that the requirements are met (e.g., 'check that everyone wears safety equipment').