What is Statistical Process Control?
It is the application of statistical techniques to understand and analyze process variability. To apply these techniques, an initial phase of variable configuration is required, followed by a phase of value acquisition.
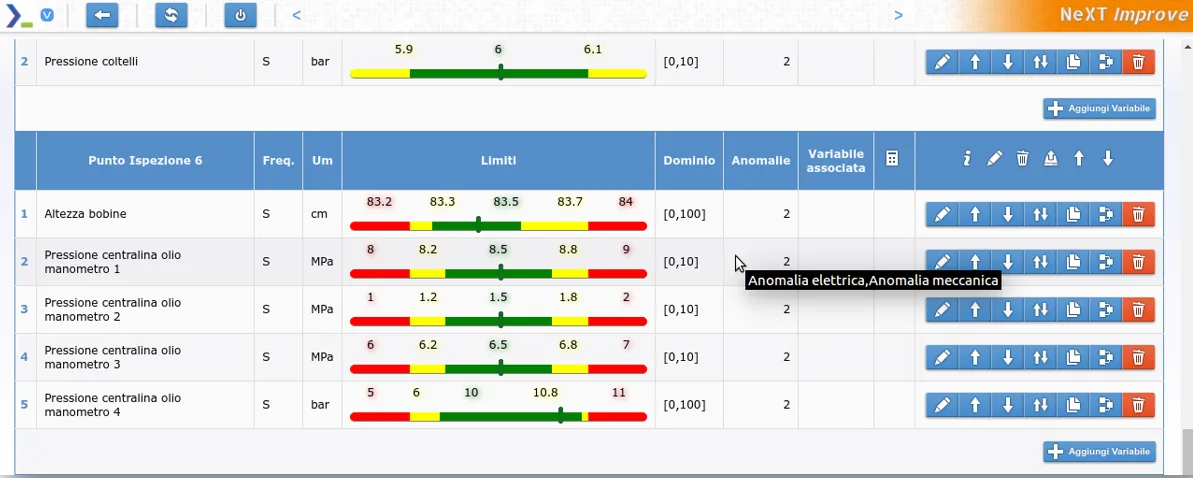
Variable configuration
The process owner can define the variables of the control charts, that is, define the concept of out of control.
The possible fluctuations of each variable are indicated by colors. These correspond to the different suitability of the parameters set by the process owner.
The red zones indicate negative values that affect the quality of the product or other aspects of the production process.
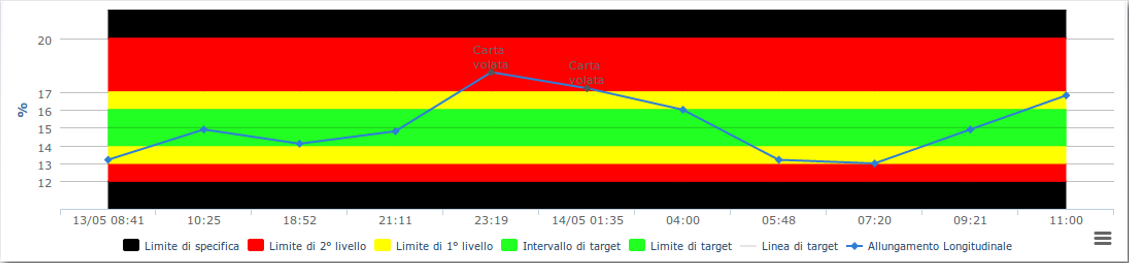
Statistical Techniques
For each variable, it is possible to create the control chart with its values over time. This will allow for visually checking for any out-of-control (OOC) situations.
After creating the control charts, the next step is to define the causes of out-of-control situations and the flow of corrective actions: one of these tools is the OCAP (Out of Control Action Plan), a flowchart that contains the series of operations to follow in order to manage an out-of-control situation.
With the help of the Pareto chart, we will be able to identify the causes that most affect the phenomenon under examination and, therefore, evaluate the intervention priorities for solving the problems based on objective criteria.
Finally, the cause/effect diagram (or Ishikawa diagram) is used as a tool to identify the causes, i.e., the relationships between a characteristic and its factors, and thus find the solution to the problem.