Industry 4.0 >> Data acquisition
Data acquisition
Data acquisition is the most advanced function of IMPROVE.
Through it you can achieve the highest level of knowledge useful for improving your productivity. And this is possible thanks to the huge amount of information (data, variables…), acquired directly from the field, which is also useful for training deep learning models.

What:
the most INTELLIGENT way to improve
Configure, acquire, analyze. Decide.
Configuration of Variables
Defining Out of Control
In a first step, variables are configured, determining what the acceptable deviation for a given value should be.
Data acquisition
Directly from the field
In two ways: automatically from the system (e.g., PLC); manually from the operator.
Data Analysis
Statistical techniques and visual and tabular reports
Data analysis makes it possible to simplify information and overcome the “paralysis effect” that can occur at the source of an excessive amount of data.
H:
IoT + IMPROVE 4.0
Sources, Agents, Statistical Process Control
Internet of Things
The Sources
IoT field devices, PLCs, energy meters, various sensors, etc., acquire any kind of data from the field, making it available to be sampled and analyzed by software agents, created ad hoc, for the IMPROVE SystemE.
Another source can be the transformation of other acquired datasets.
IMPROVE
Several types of agents, having different missions, are involved in data acquisition and analysis.
- Agents useful to sample data from the PLC
- Agents useful to provide the current state of the variables
- Agents useful to compare this state with previously configured values, thus highlighting outliers and triggering automatic actions of various types
Statistical Process Control
Data analysis techniques
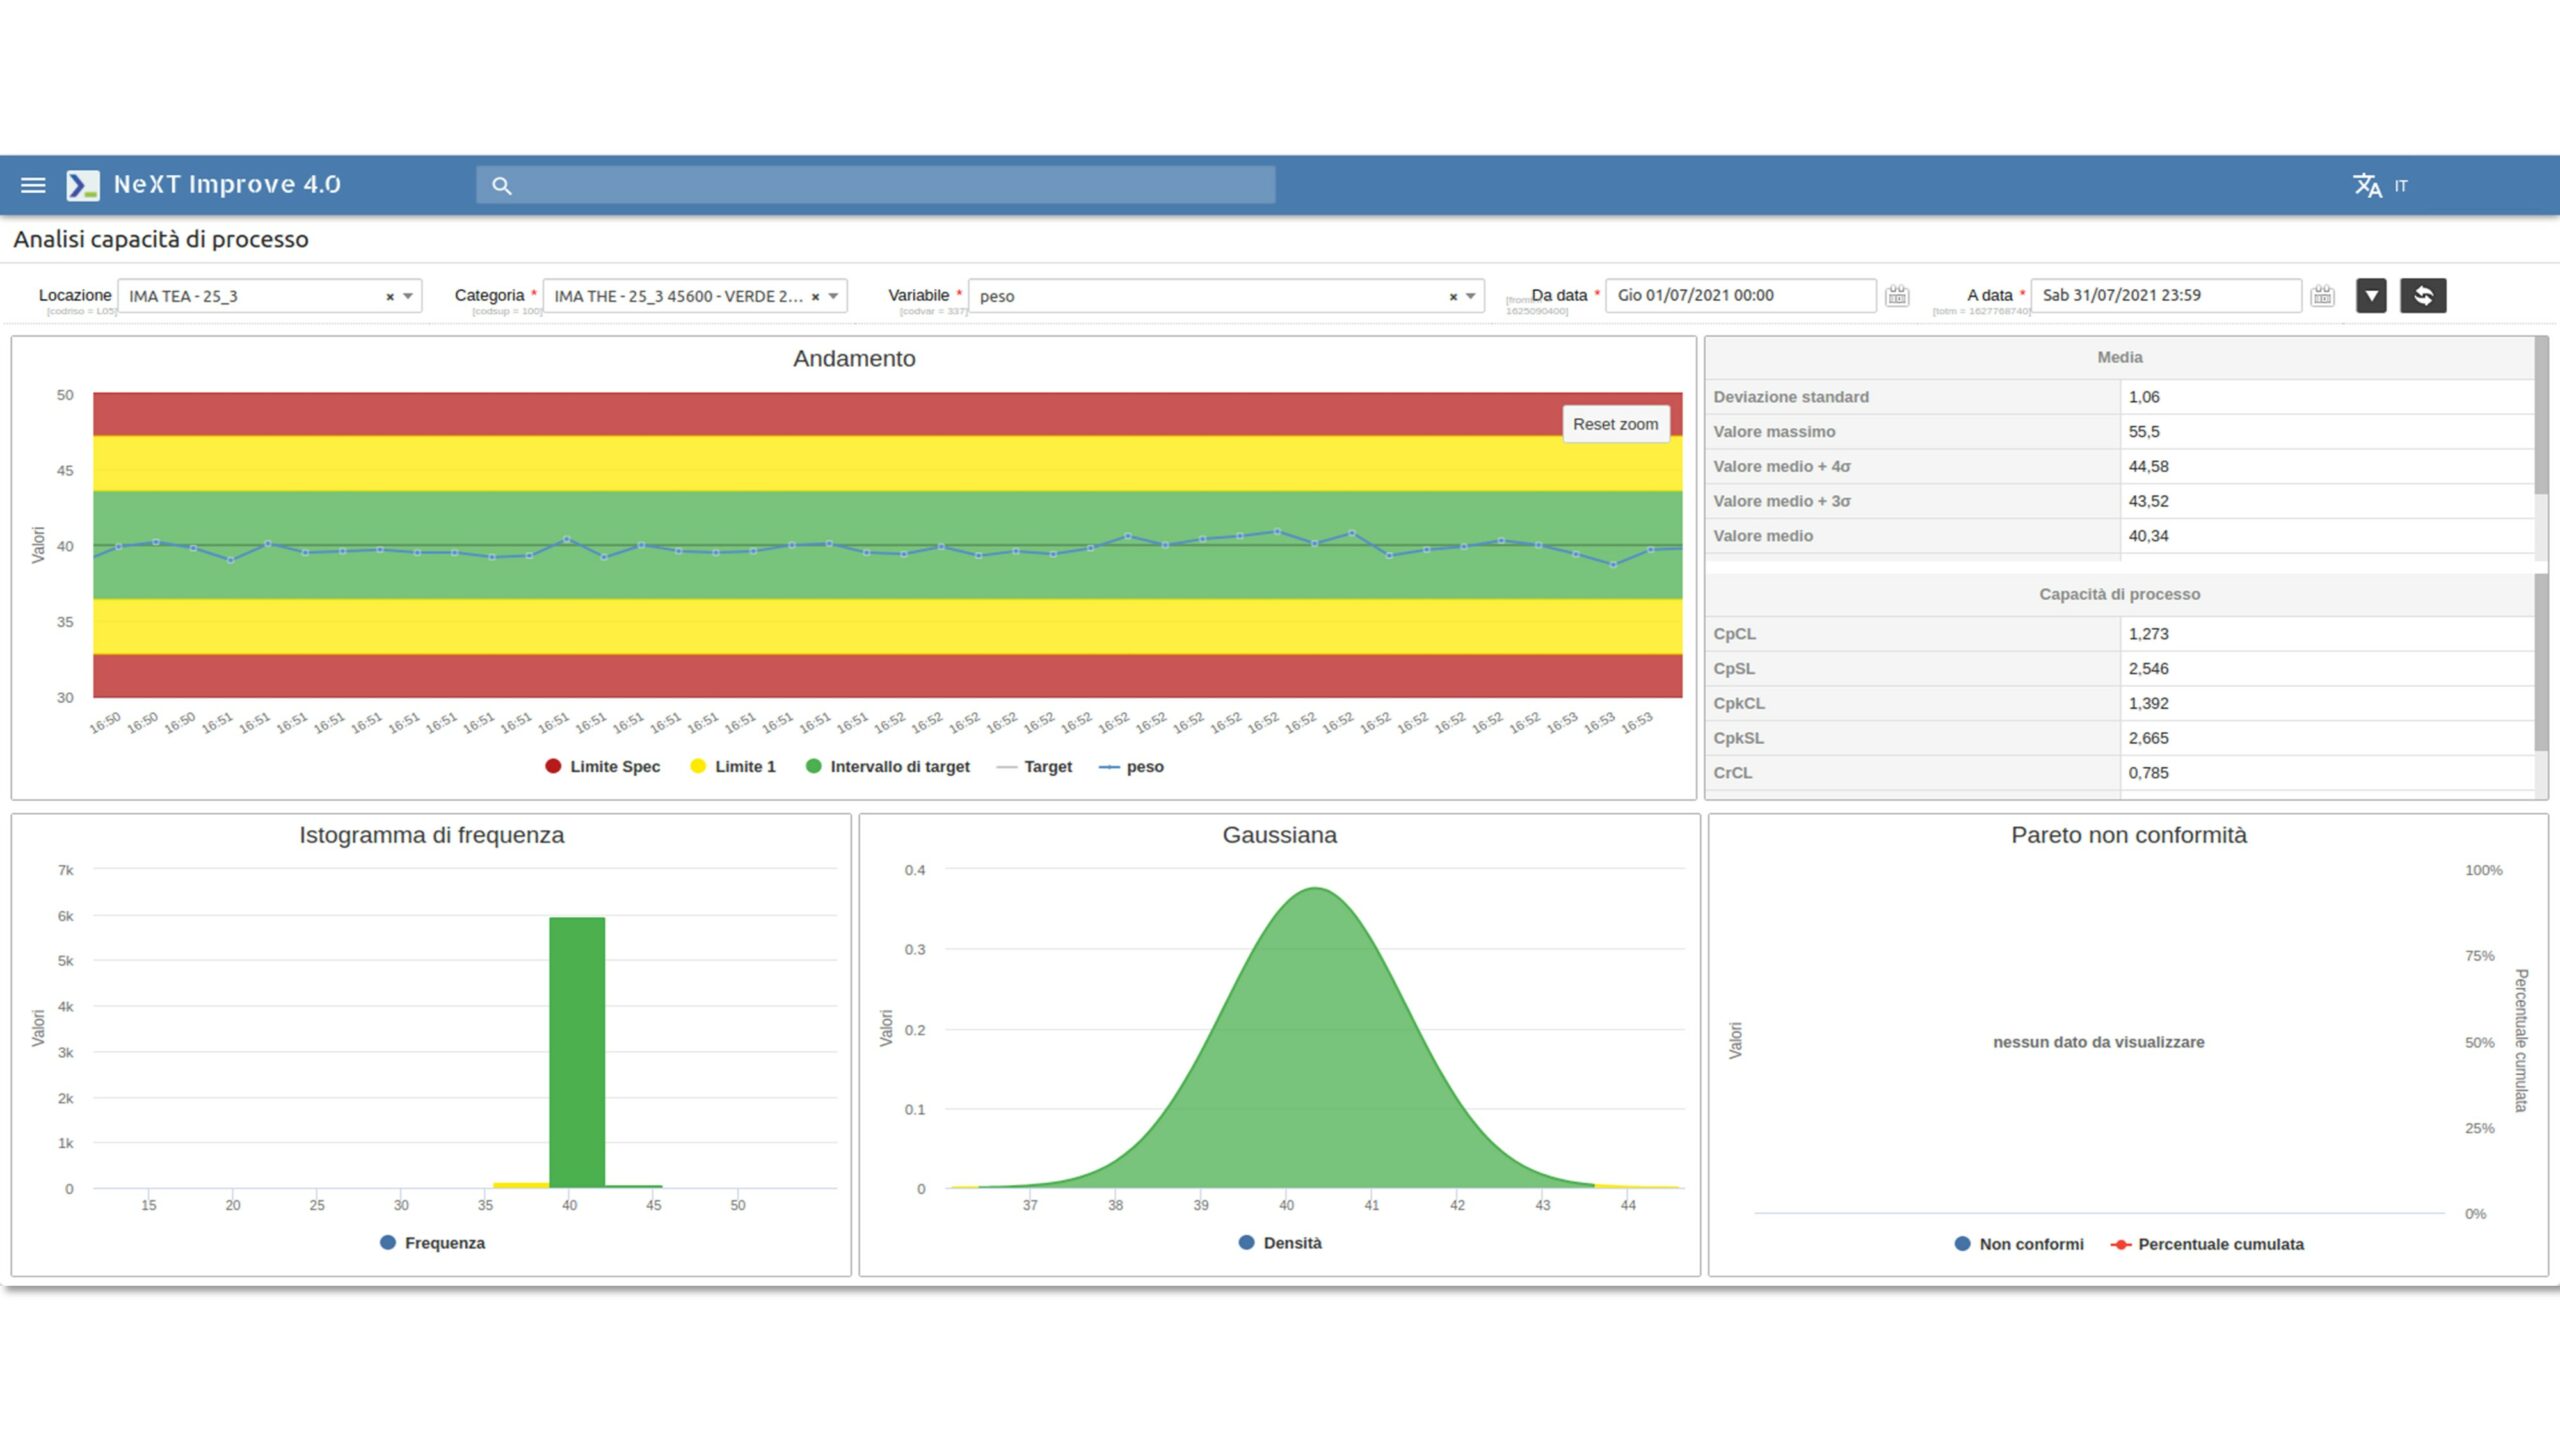
Several tools are used for data analysis, derived from Statistical Process Control:
- variable trending
- statistical analysis
- process capability analysis (cp, cpk)
- histogram (shape of distribution)
- gaussian analysis
Ready to… decide?
Reports
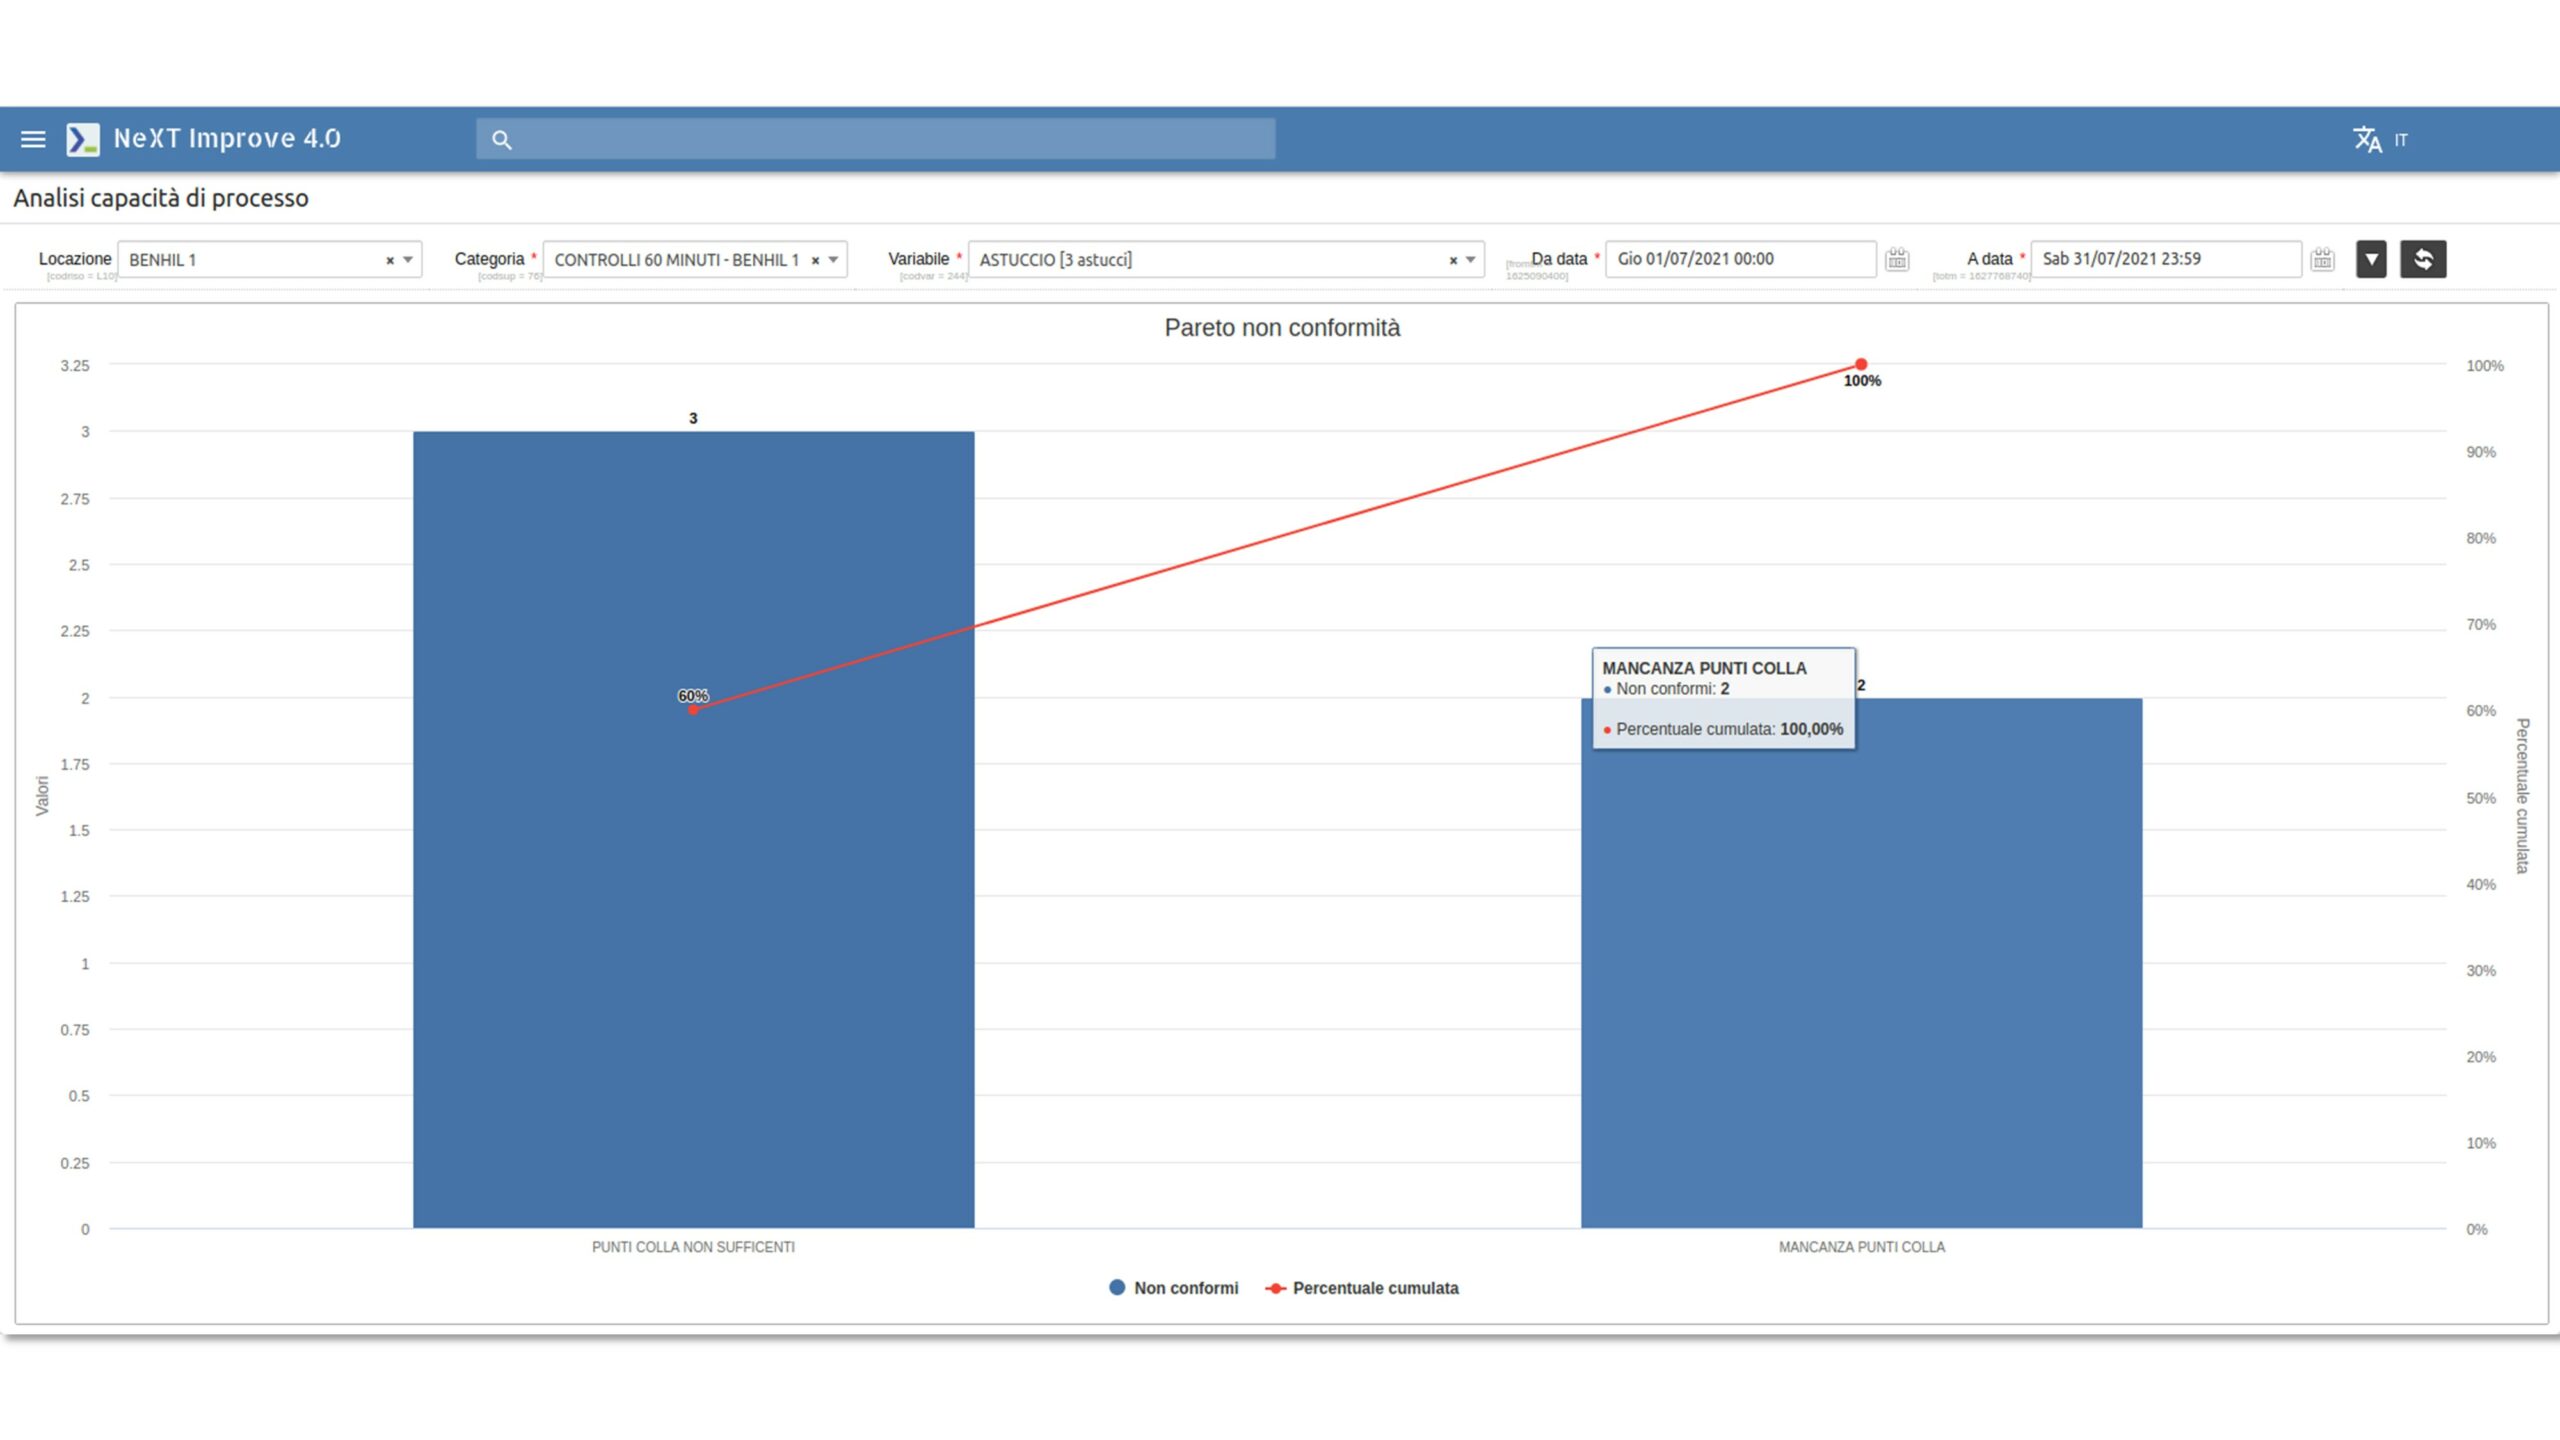
The results of the analysis phase are embodied in a series of reports: the data are organized both in tabular form and in graphs derived directly from statistical process control.
Visual reports are of various types: frequency histogram, Gaussian analysis, Pareto charts, process capability, up to multivariable analysis, i.e., correlation analysis between variables

"Without statistical control, the process proceeds in an unstable chaos that is bound to mask any improvement attempt."
– William Edward Deming
Ready to… keep going?
We develop software solutions to provide aggregated data dedicated to business management, supporting them in operational decisions.
The excellence of service quality is guaranteed by the agent type of programming and the strong emphasis we give to research and development.
Within its most advanced systems, NeXT solutions include the use of Artificial Intelligence and Machine Learning models.
© 2023 NeXT Srl Unipersonale - P.IVa. 02510420421 - Privacy and cookie information - Powered by Fuel31


