Industria 4.0 >> Digital Shopfloor Management
Digital Shopfloor Management
The entire factory management software:
It’s the tool for controlling the factory and the entire production process.
It enhances the ability to process all available information, use it to solve immediate problems, and make decisions on a daily basis.

The ideal solution for the manager
It only takes a few minutes of the daily routine to get a comprehensive view of what’s happening throughout the entire plant.
Through data and reports, graphs and tables, the DSM can guide managers’ decisions for a constant overall improvement and in so many ways.

A DASHBOARD FOR THE ENTIRE PLANT. FOR MULTIPLE PLANTS.
OBJECTIVES
- Clarify the current status of the process
- Highlight deviations from objectives and standards
BENEFITS
- Identify problems and solve them quickly
- Optimize the production process
- Improve communication through quick and frequent meetings
- Bring order to the workflow through the 6S methodology
- Strengthen the performance of teams
ONE MORE THING...
- One dashboard for the entire plant
- Integration with OEE data
The three phases of DIGITAL SHOPFLOOR MANAGEMENT
1. OBSERVATION
Problems are observed
and highlighted
- Creation of action plan to solve the problem
- Designation of a responsible person to manage the action plan
- Data that can be taken from ERP or OEE or inserted manually
- The observation can also make use of tools such as theObservation app and the Gemba Walk
2. COMMUNICATION
Checking the status of issues through brief daily meetings
- Verification of all open reports
- Analysis of the state of things, in the various subject areas
3. OPERATIONS
Each report and meeting are followed by a series of decisive decisions
The 5 thematic areas of Digital Shopfloor Management
The areas monitored by DSM are: Safety, Quality, Delivery, Cost and Maintenance.
Of each area, it is possible to have a concise and visual view of the main KPIs, which are useful for making improvement decisions, defining action plans, establishing teams, and evaluating results over time.
These areas are considered by plant and by individual departments and production lines.
Each area has the opportunity to define action plans, which are very similar to each other, although oriented toward its own specific theme.
The action plan always has a duration and a dead line to reach a solution to the problem.
Safety
The goal of the “SAFETY” area is to achieve a drastic decrease in accidents and create a hazard-free work environment.
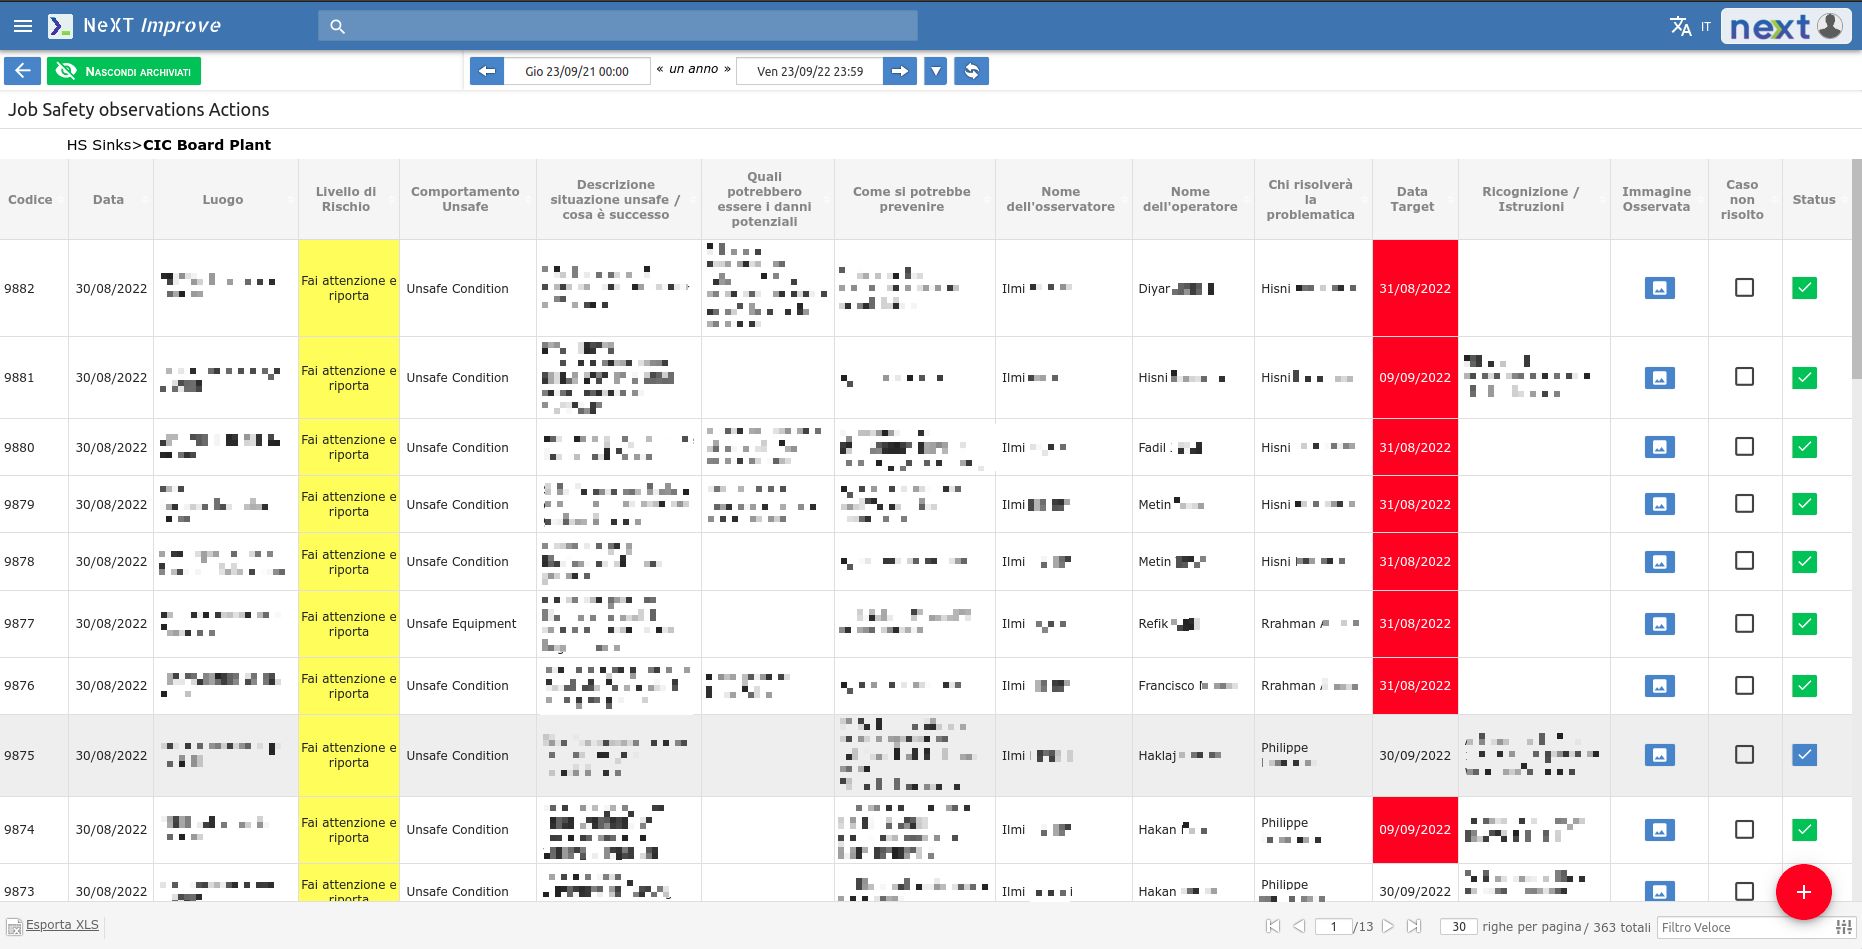
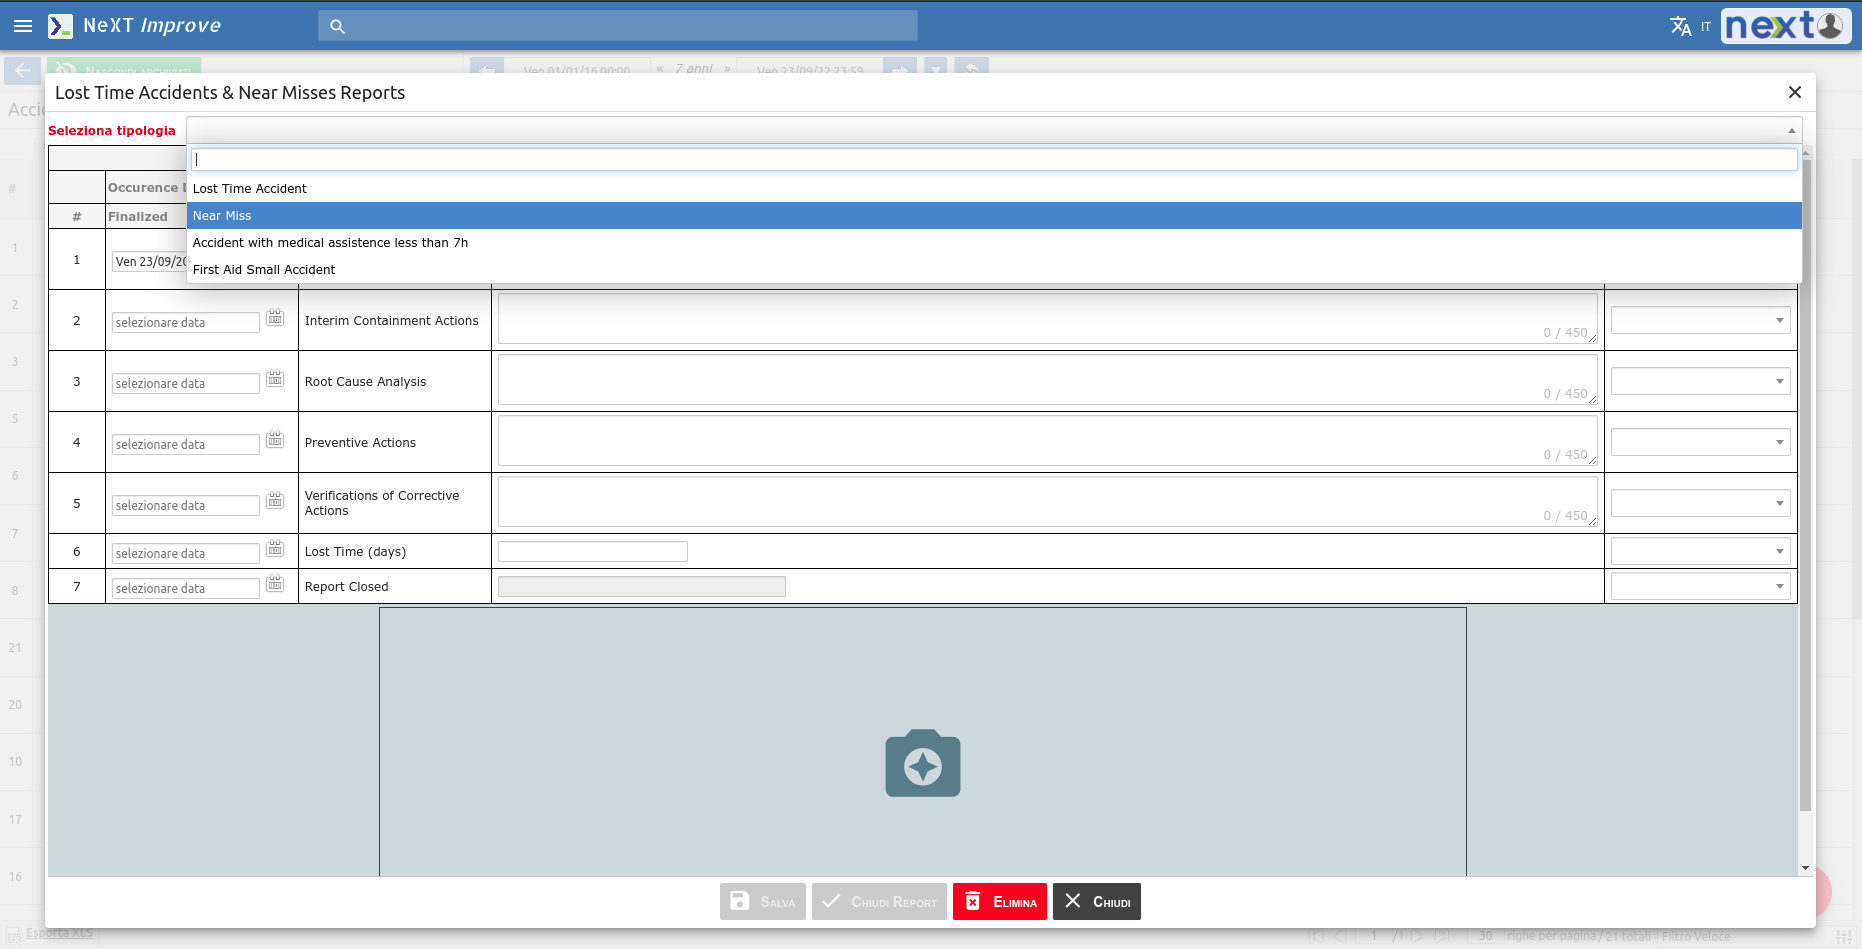
For this reason, the action plan of this area is the most information-rich and also makes use of Job safety observation action, which is the possibility of reporting accidents, near misses or potentially dangerous situations, through the use of a smartphone.
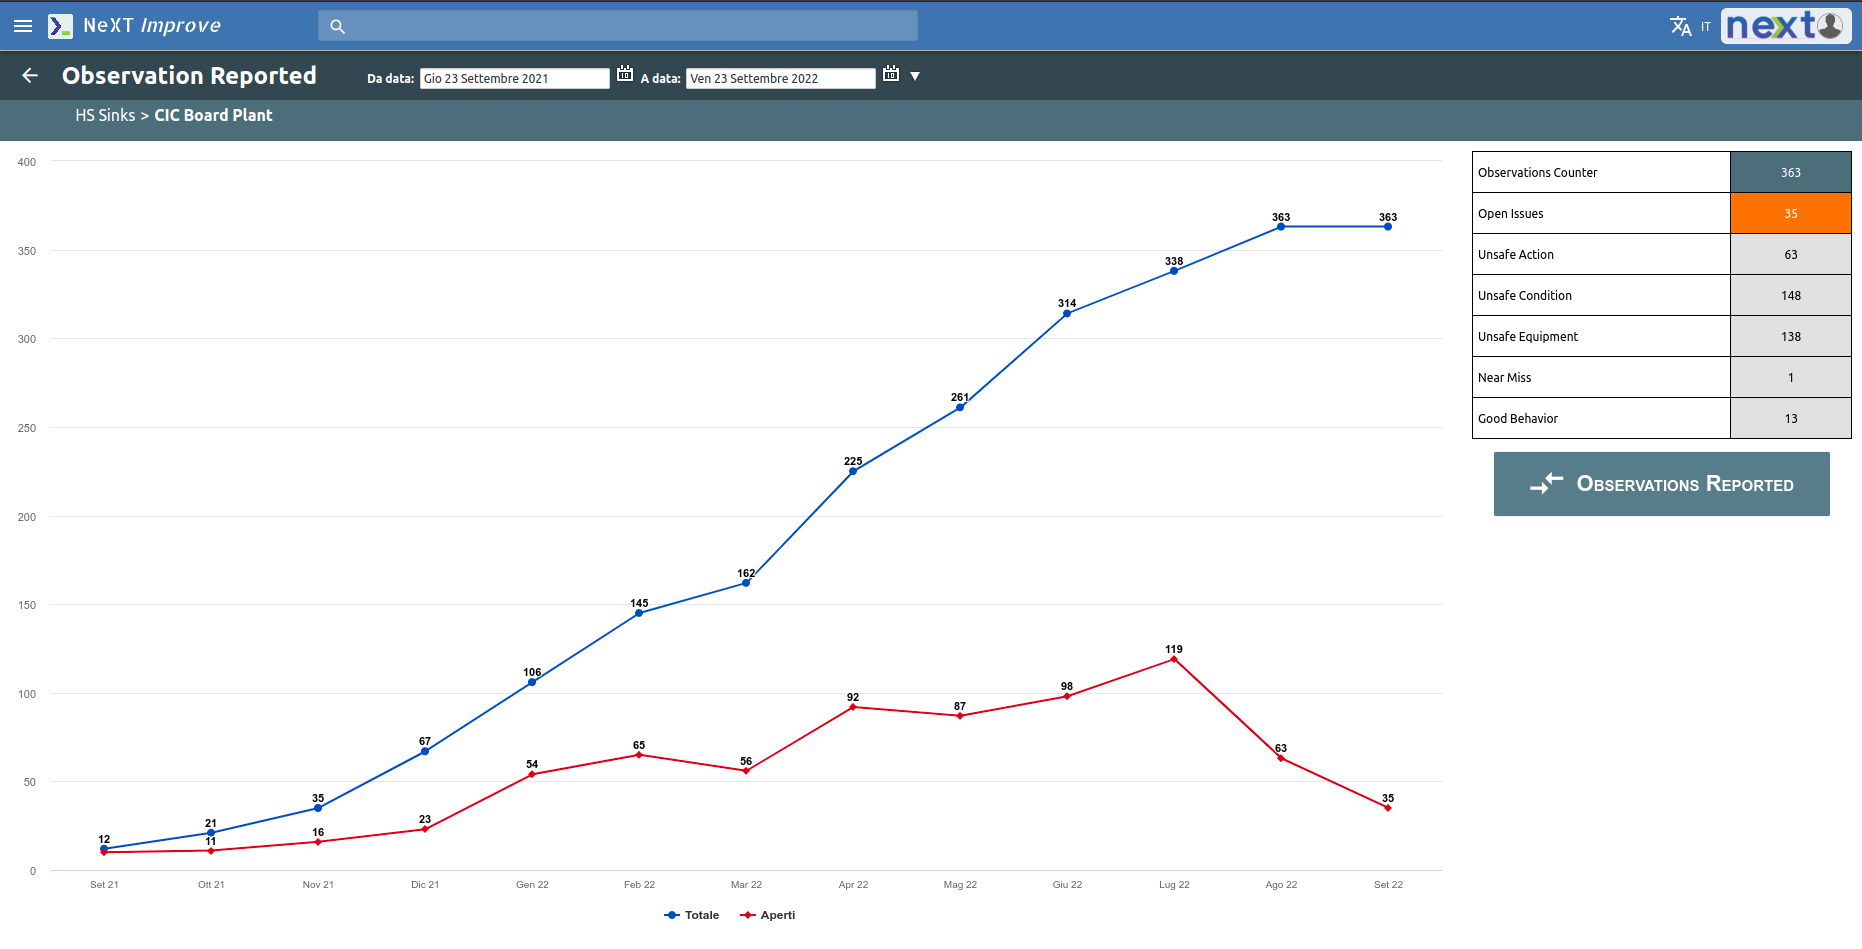
Each report generates an action plan to be managed by a team and manager by a specific date.
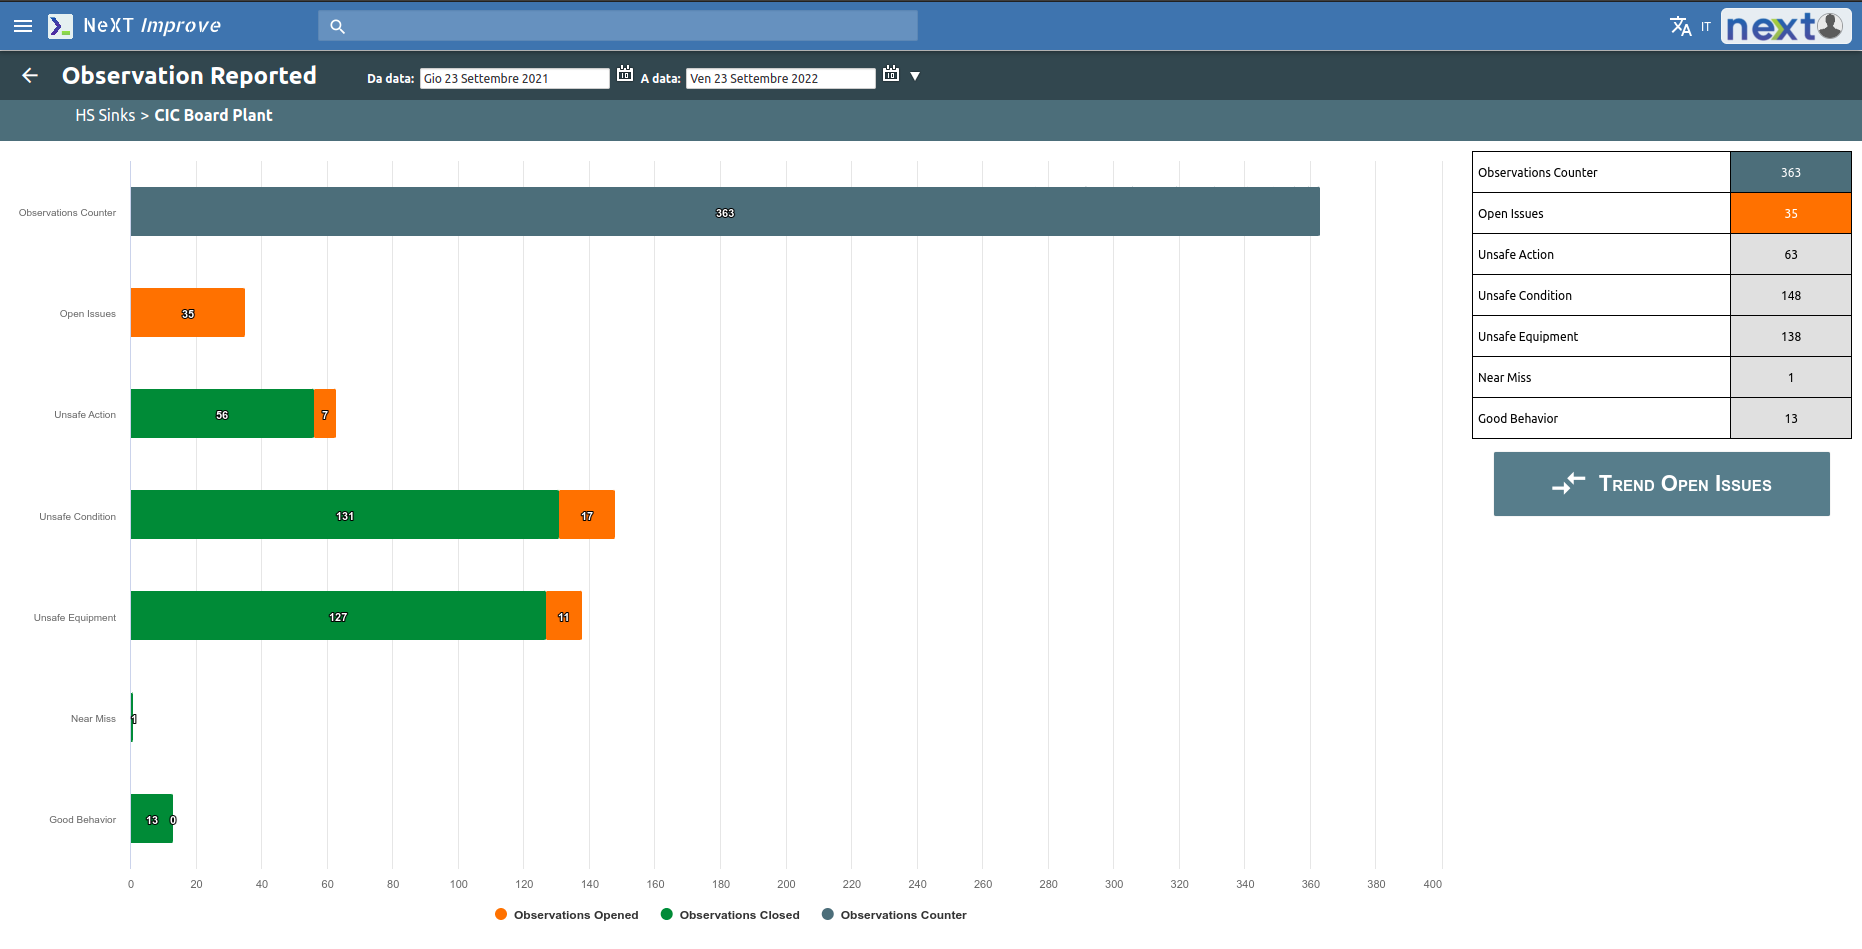
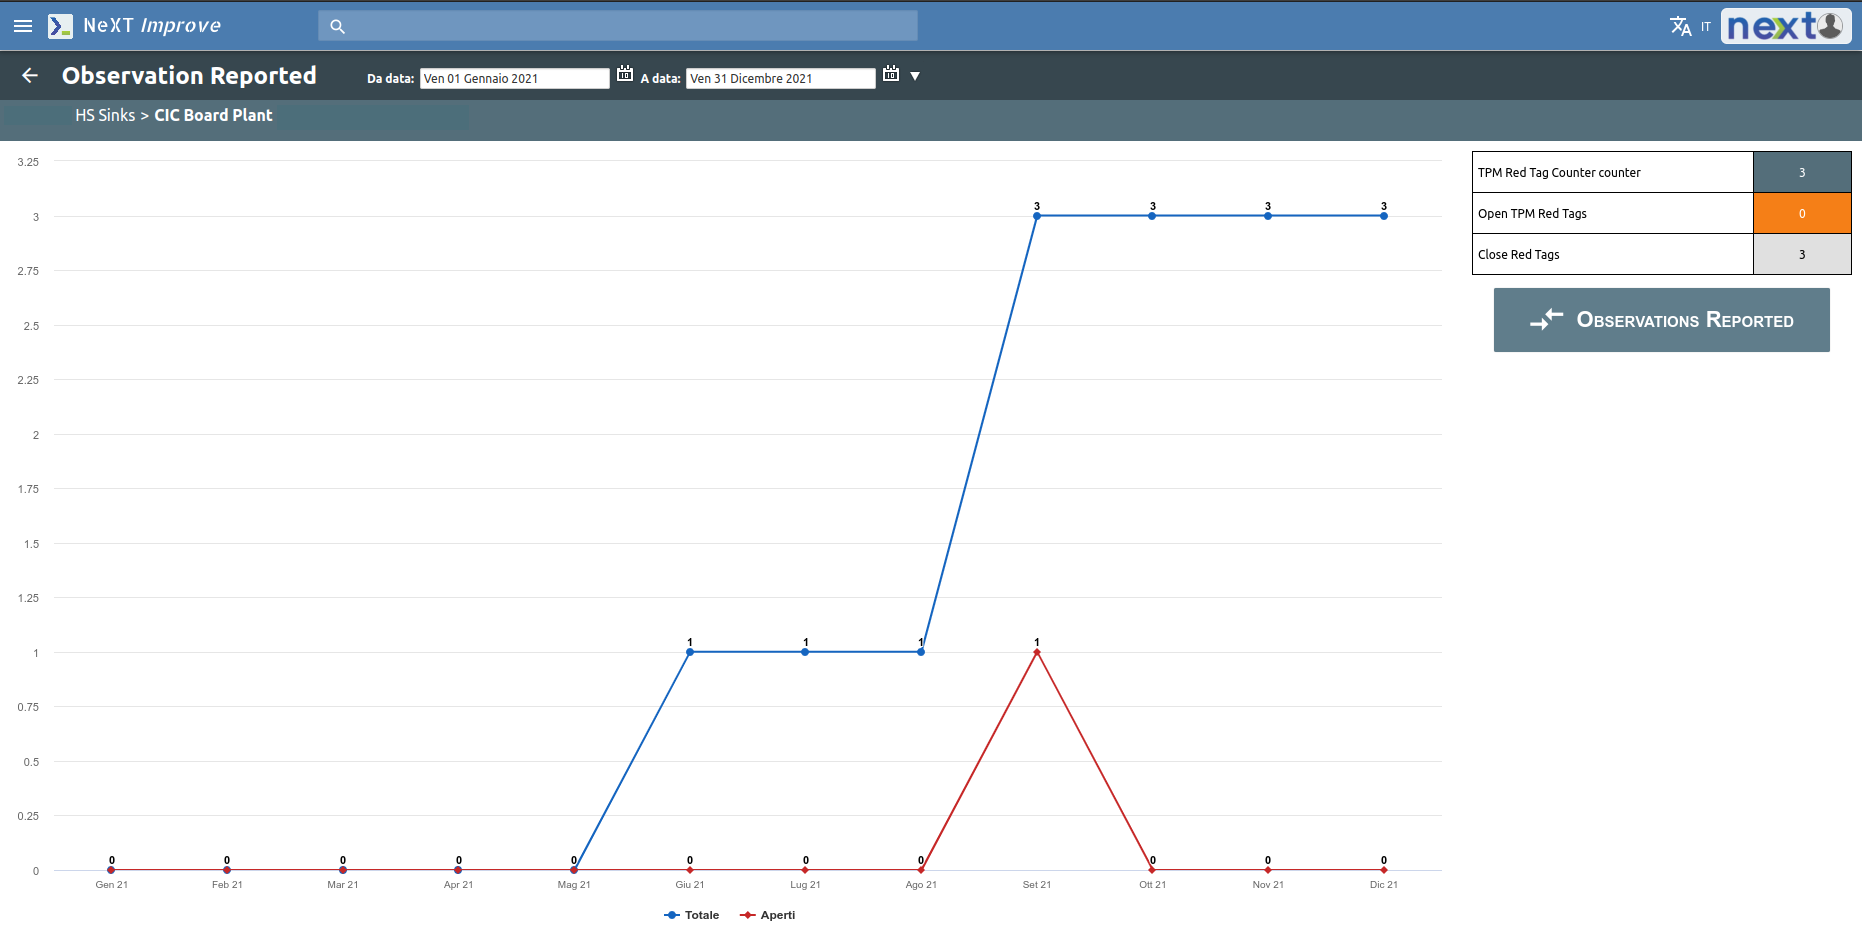
All information regarding reports, solved problems or open issues are shown through visual reports.
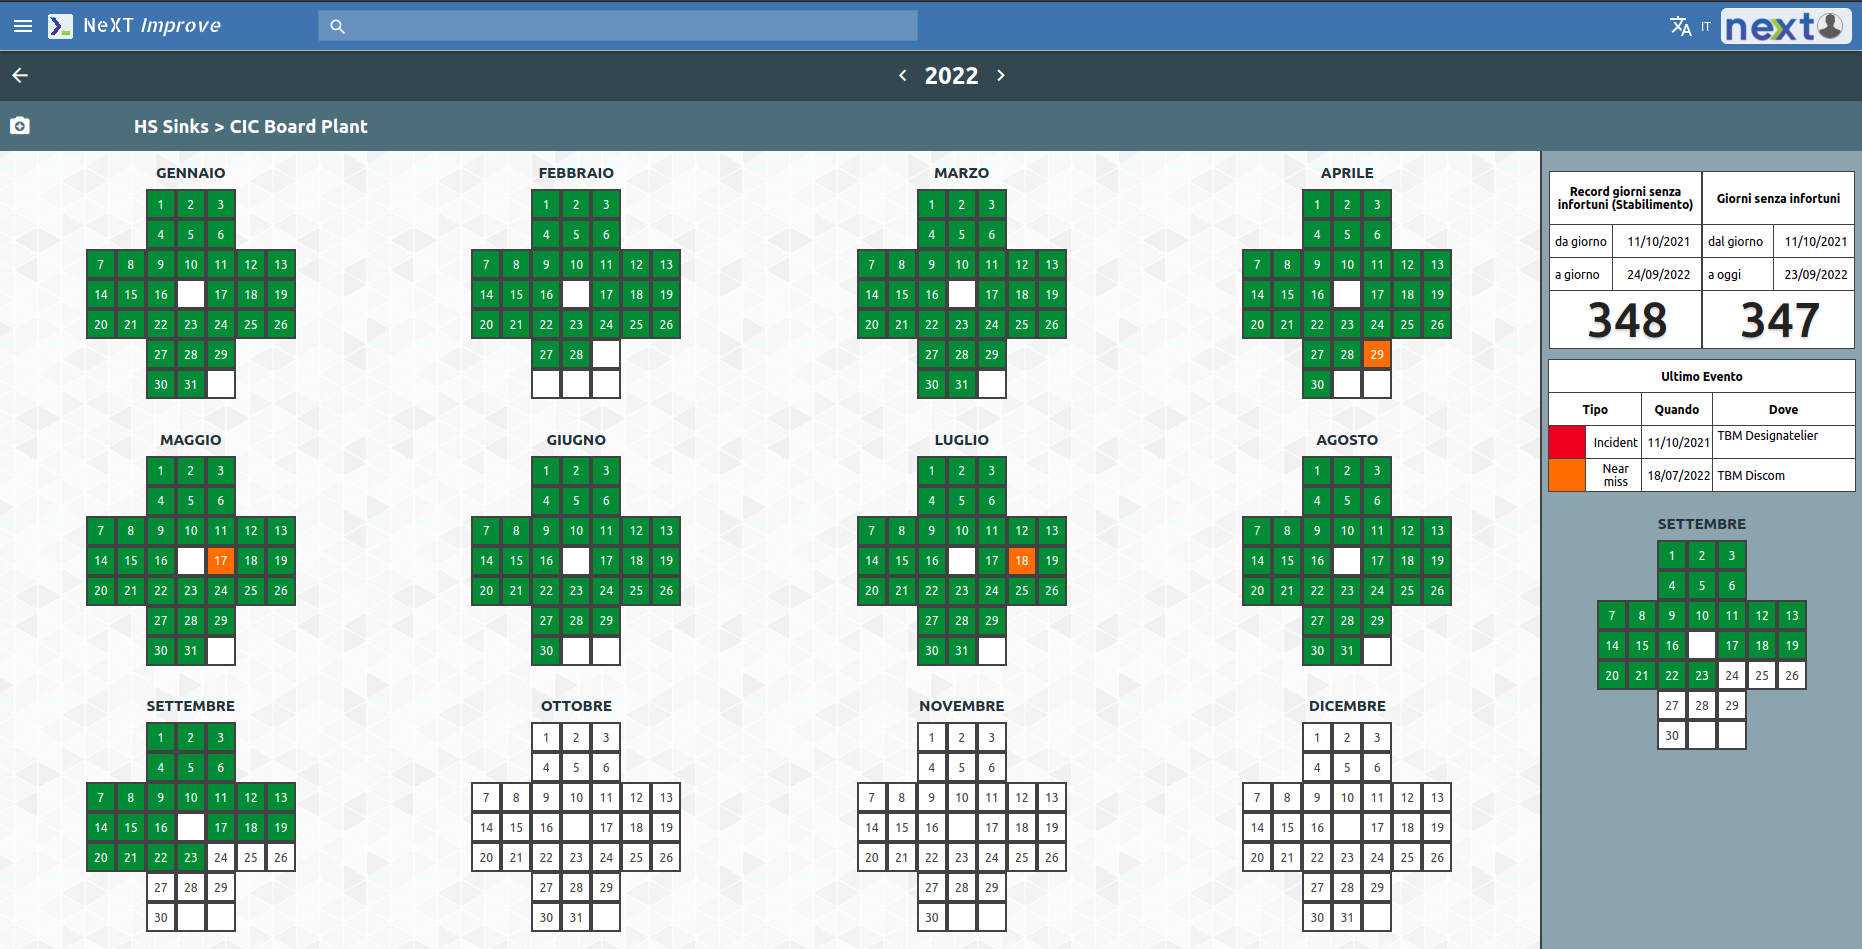
The Green cross graph shows the general trend of injuries in the company immediately highlighting any criticality in specific departments.
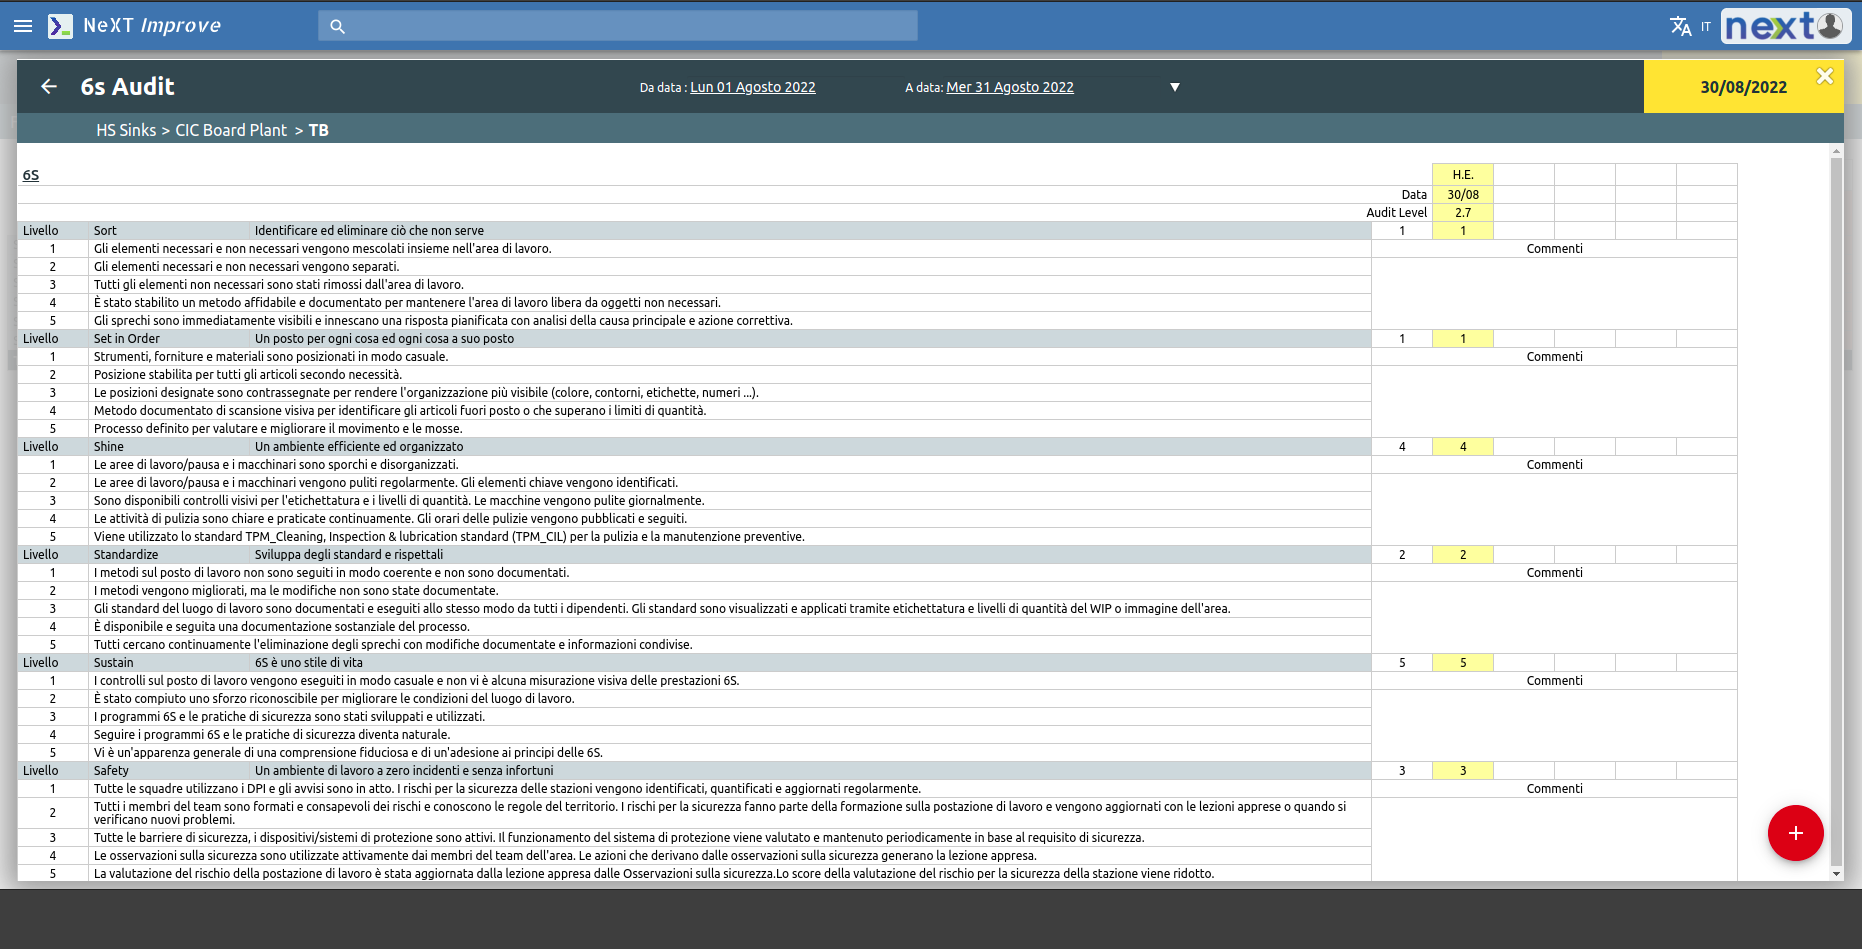
Finally, it is possible to schedule Audit 6S (Sort, Sent in order, Shine, Standardize, Sustain, Safety) and monitor the results.
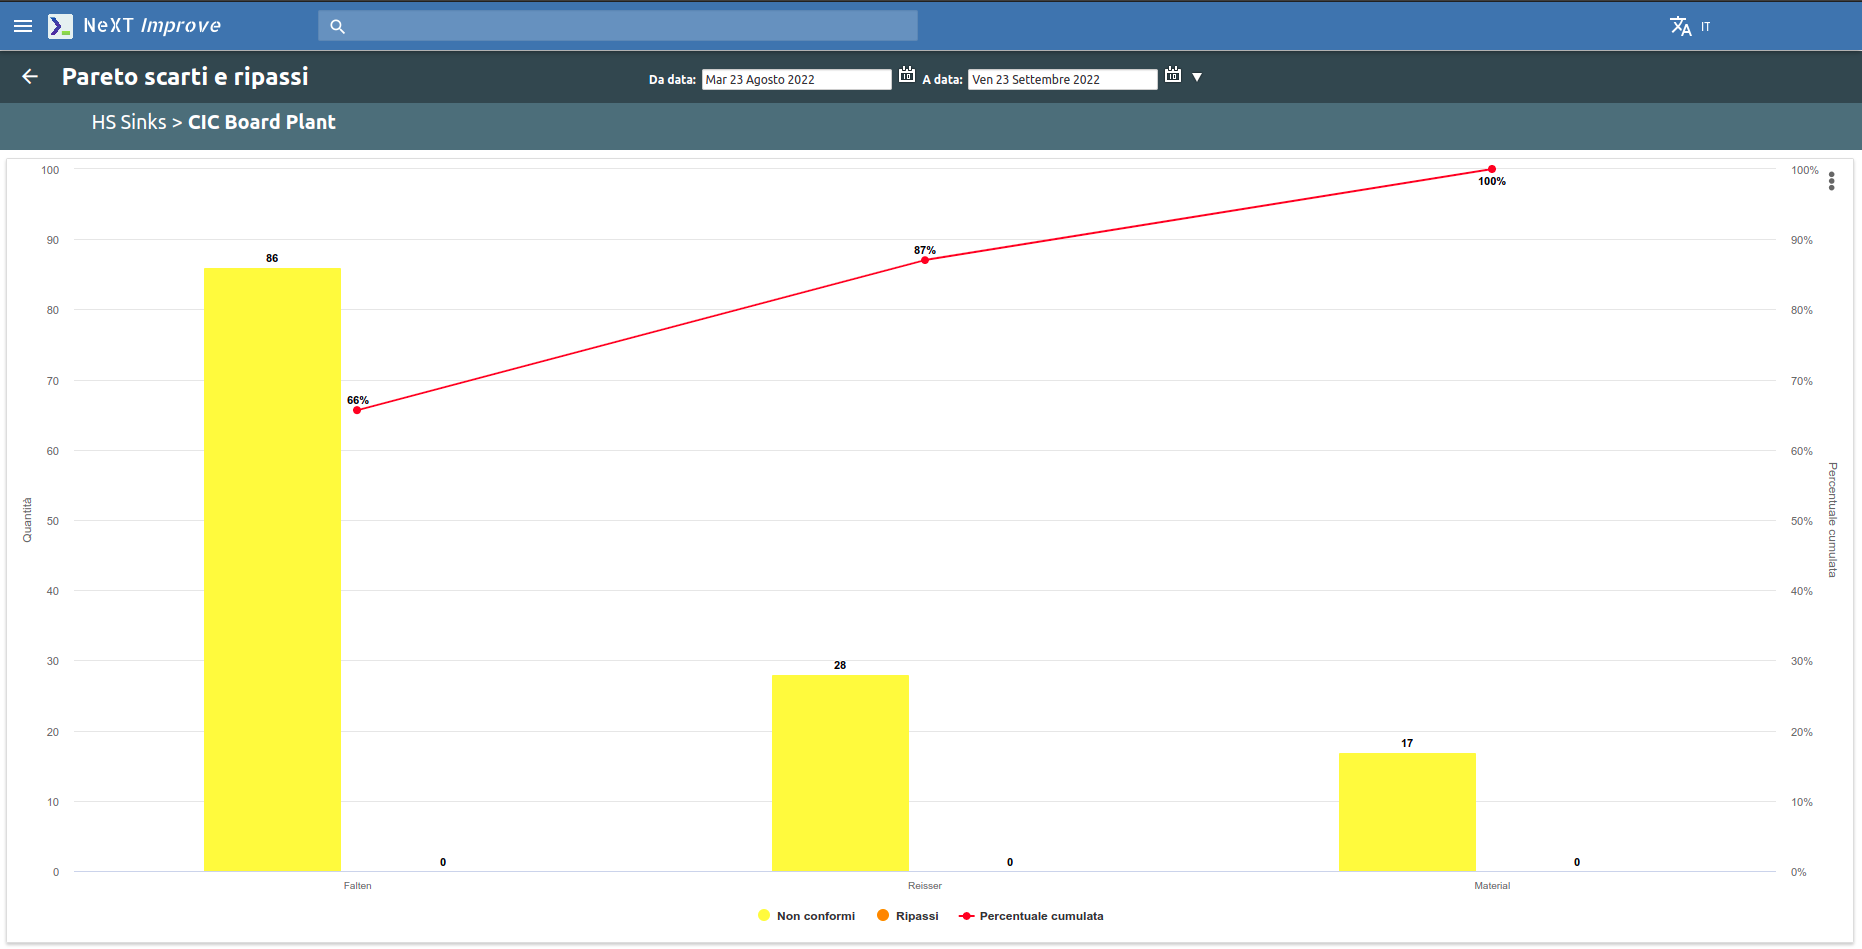
Quality
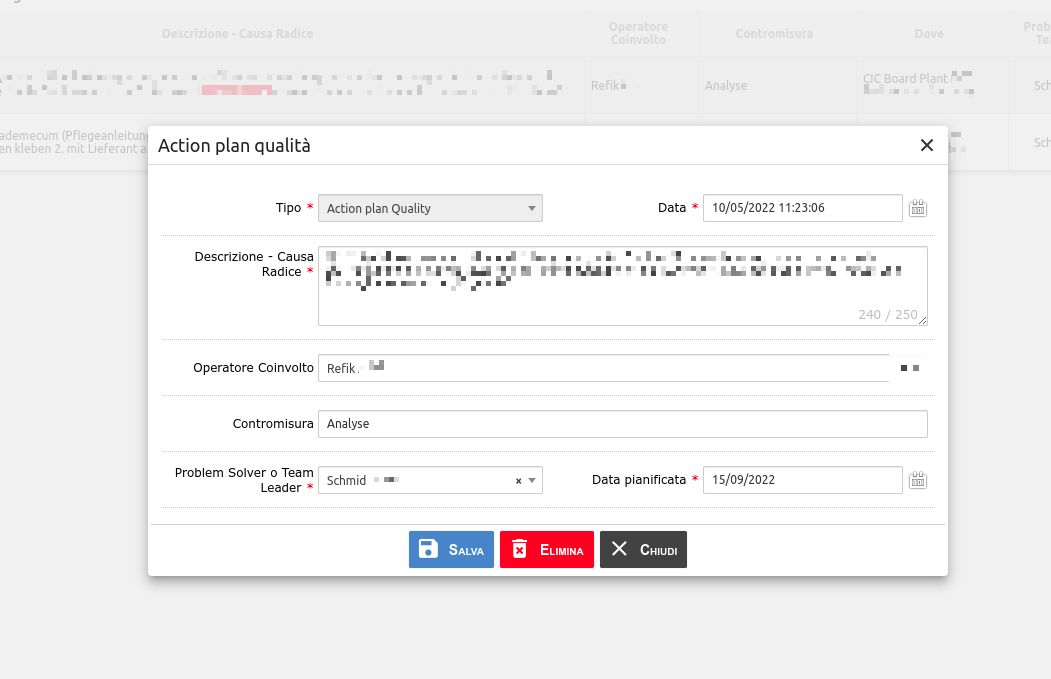
A quality problem also generates an action plan. Again, it is assigned to a manager and the countermeasure is suggested.
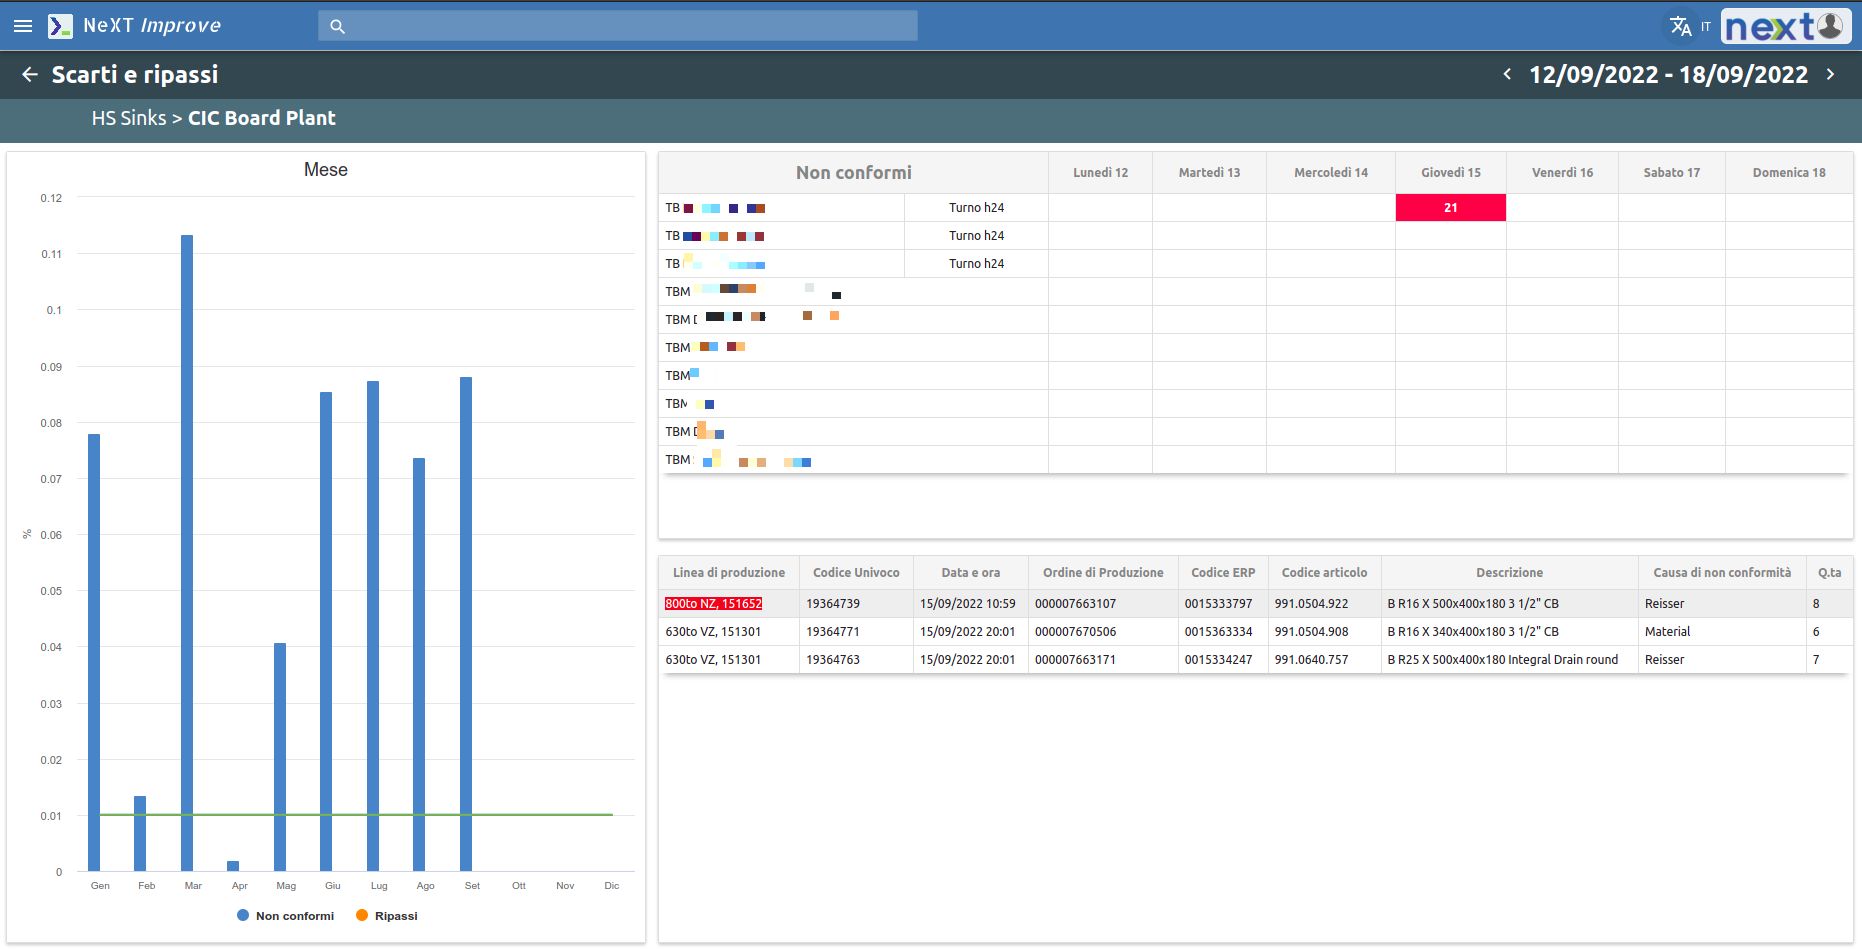
The Quality area is closely linked to the OEE (efficiency monitoring). Data coming directly from this system generates the related graphs of rejects and rework, organized by months and weeks.
It is possible to set an allowable reject threshold, beyond which you do not want to go.
All this can be seen at both the plant and department level.
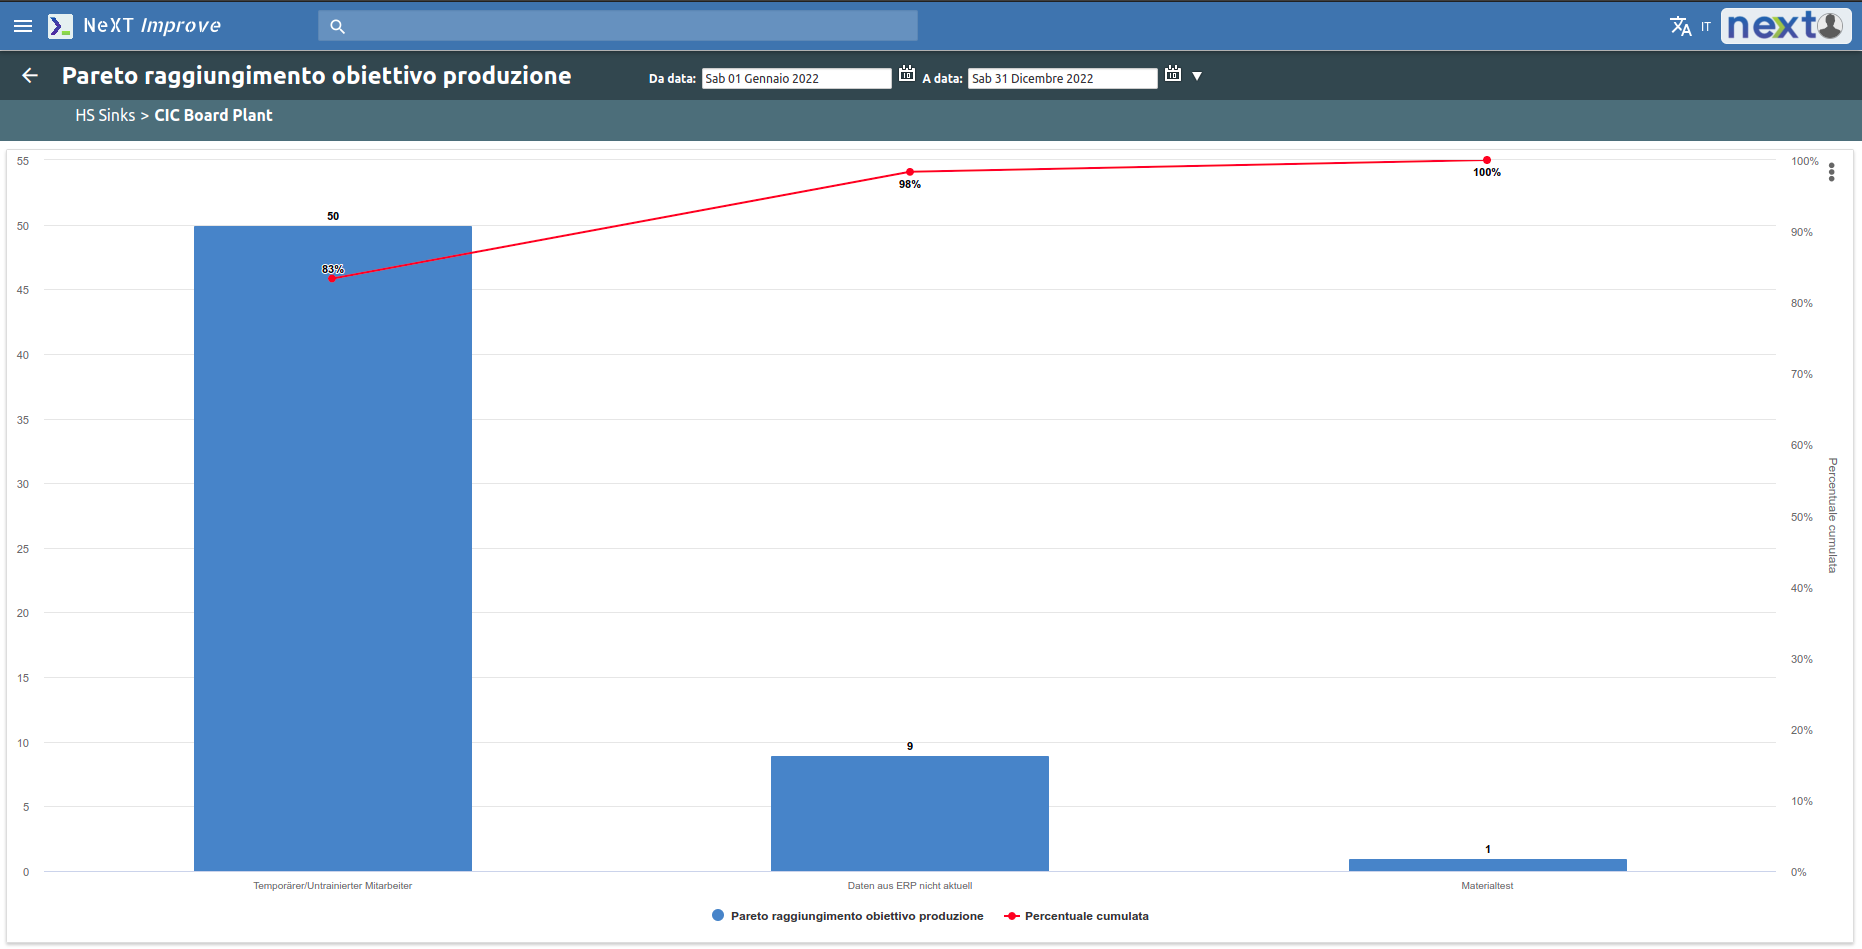
Pareto charts on non-compliances and their causes are also available.
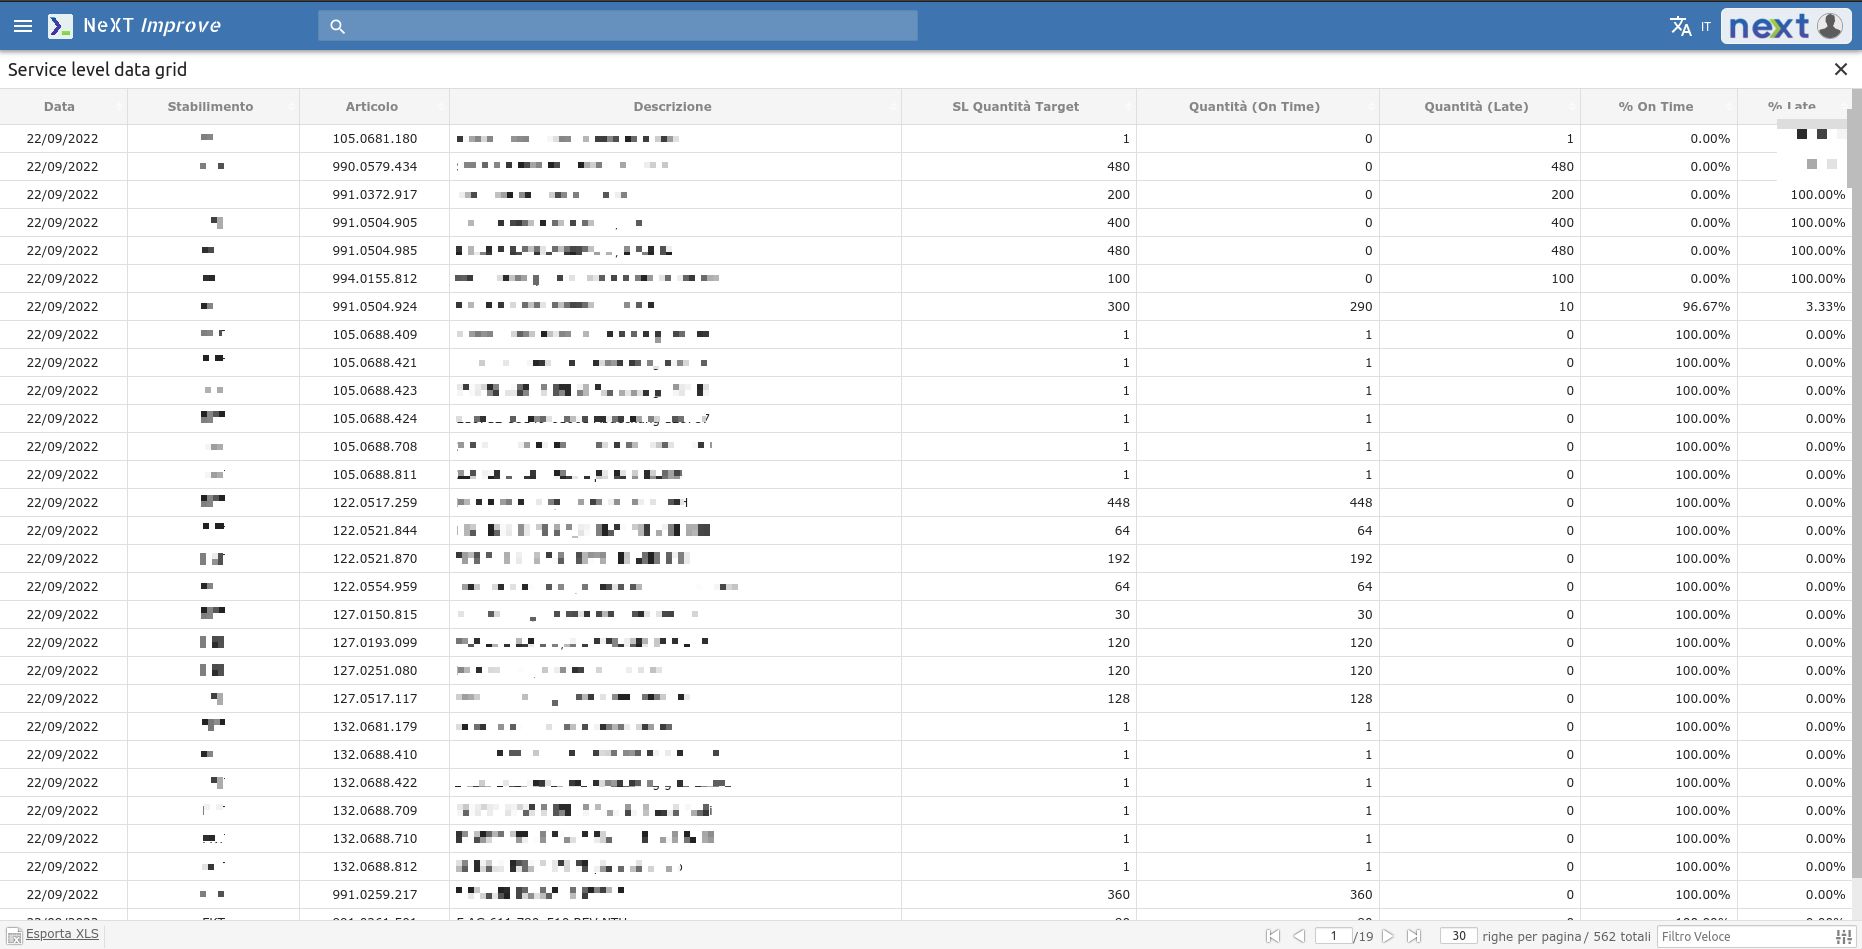
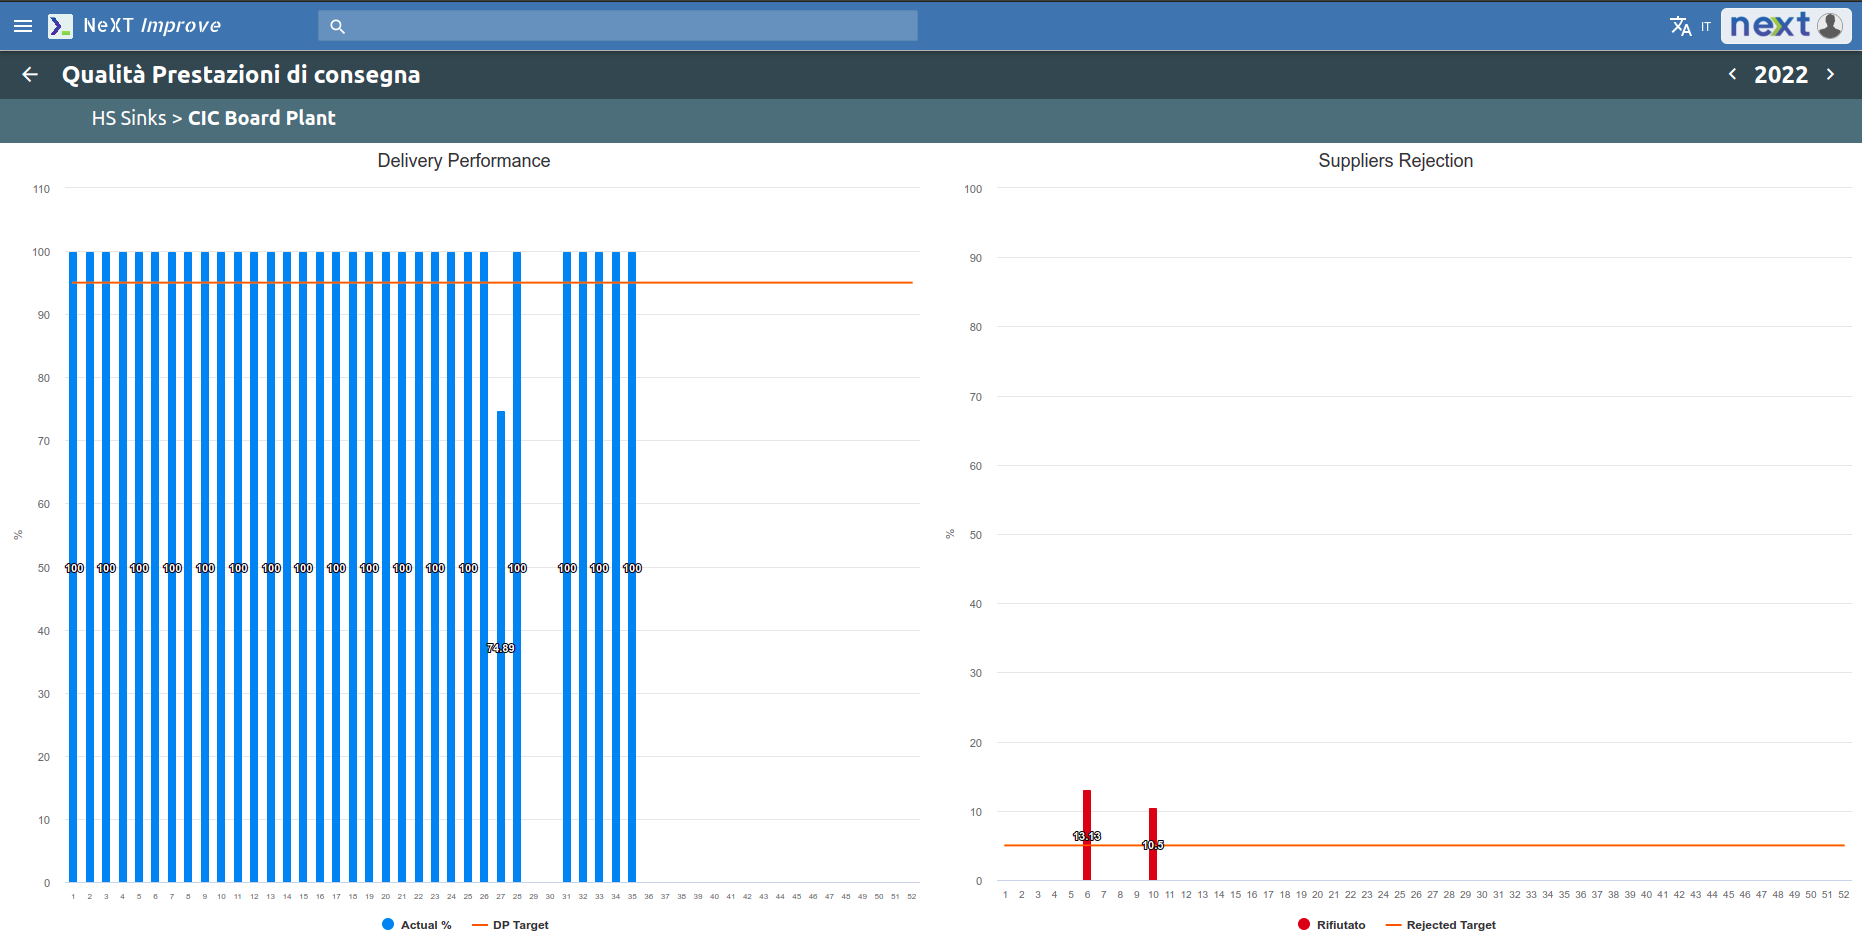
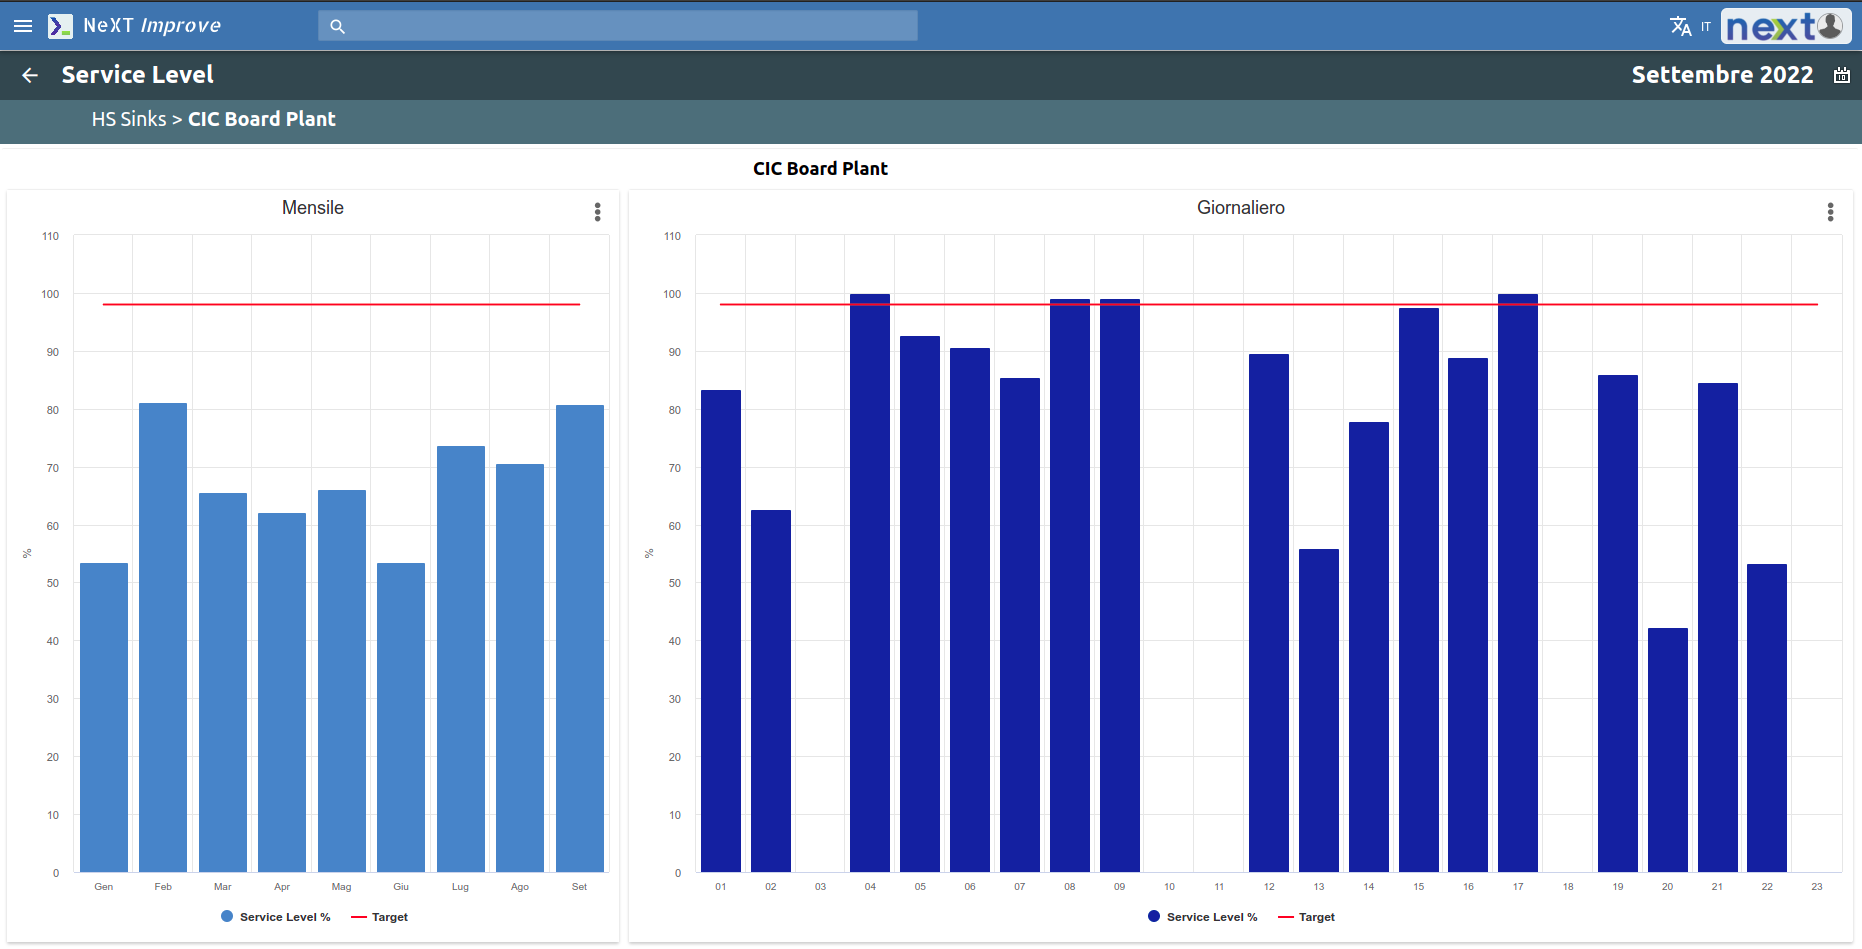
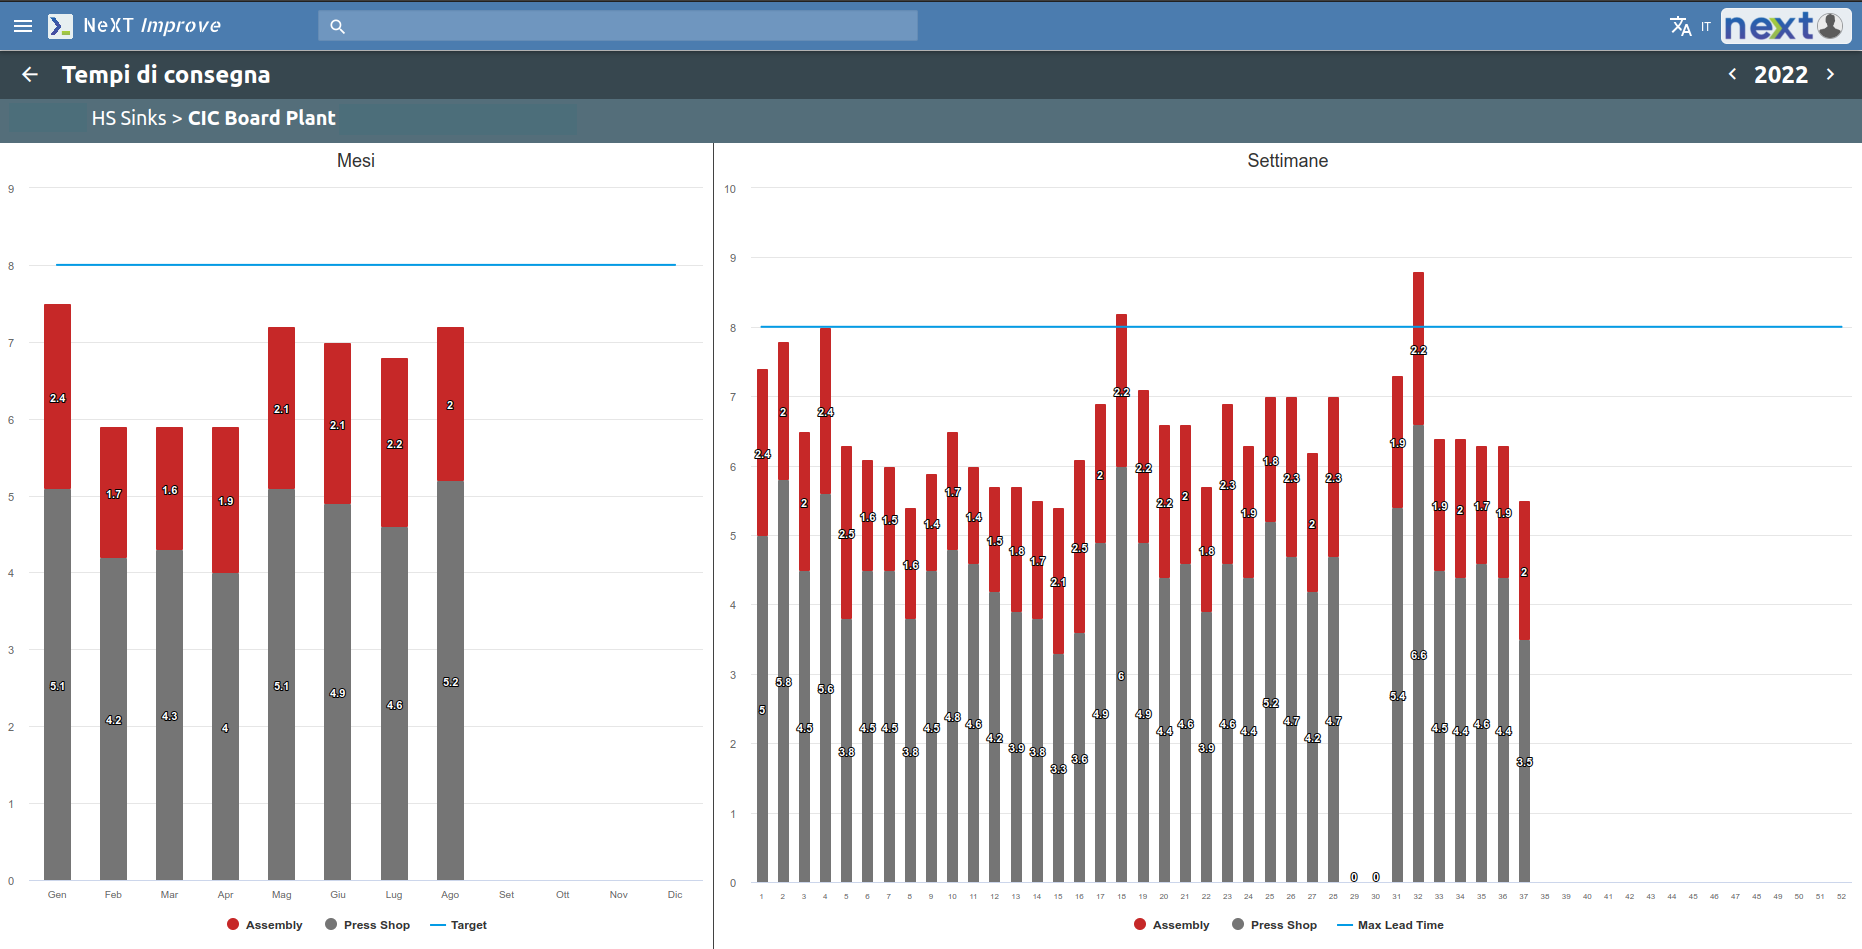
Delivery
The Delivery area is concerned with the level of service and delivery time to the customer.
Productivity is monitored by keeping track of how much is delivered on time and how much is delivered late.
It is possible to set a productivity threshold below which you should not go. Through a Pareto chart it is then possible to analyze the main causes of non-productivity.
Also included in Delivery is the inventory tracking with all data on raw materials, semi-finished materials and materials currently being processed.
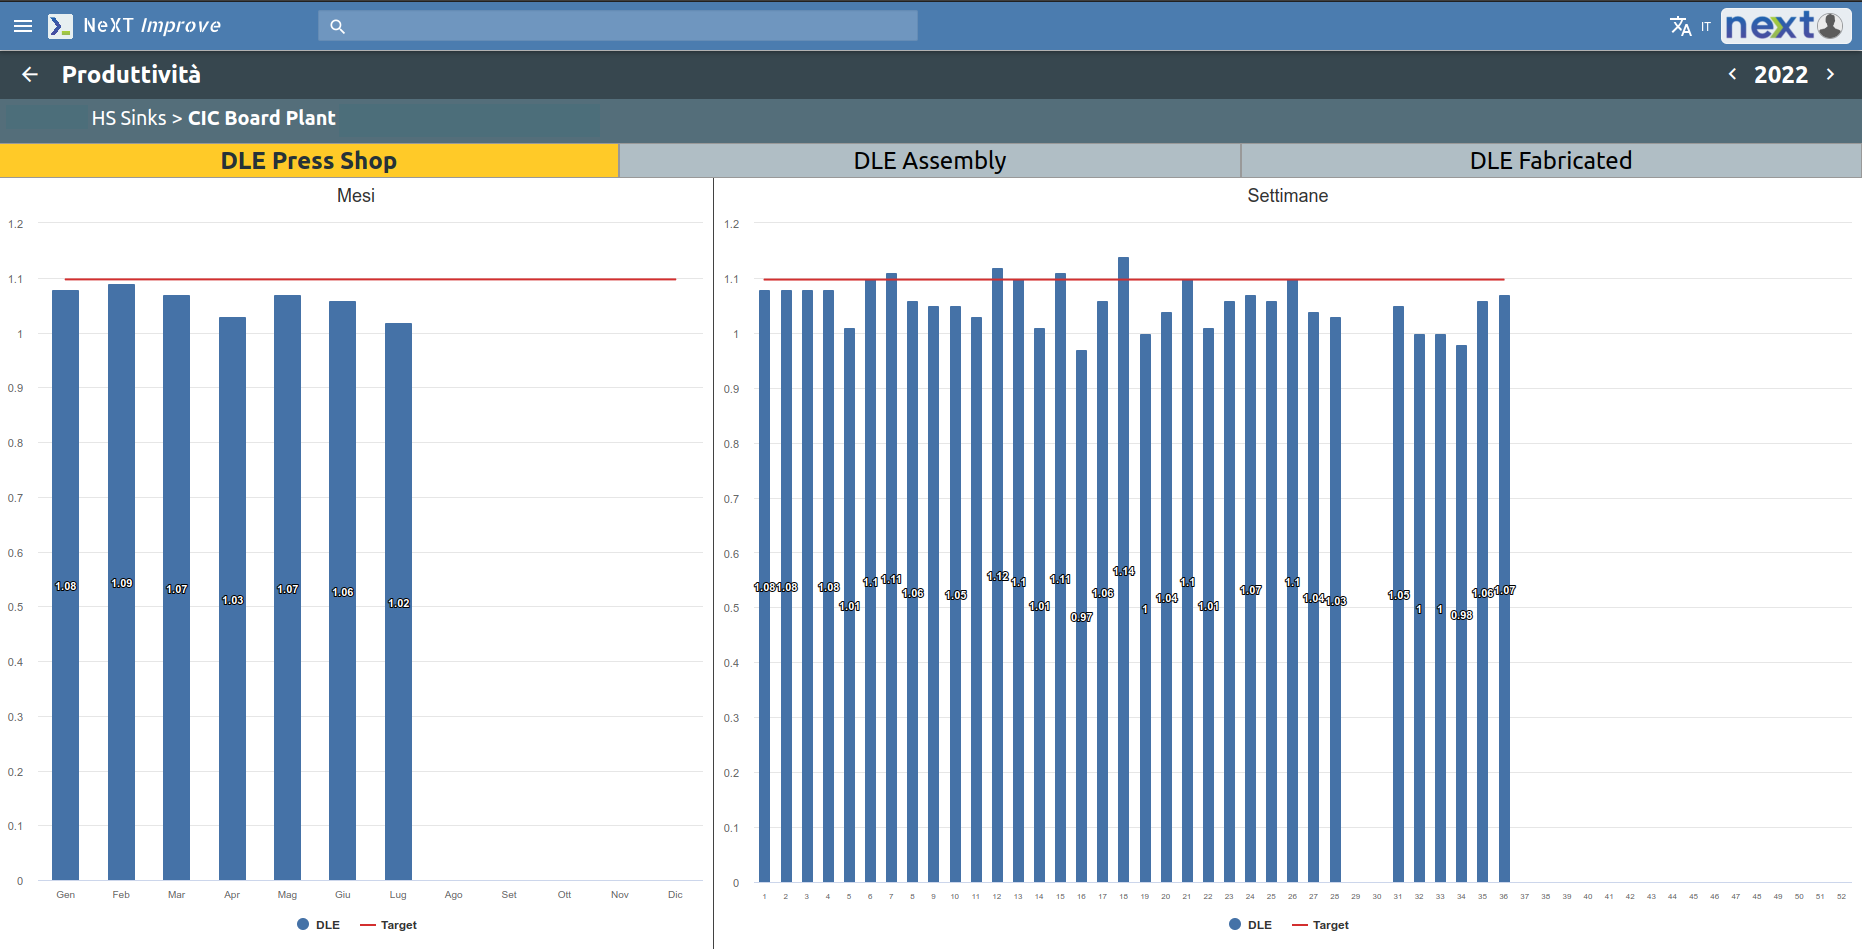
Cost
The goal of the Cost area is to find out where waste may be hiding: production efficiency is then analyzed; the length of non-production time, whether due to downtime or tooling for a new production order; delivery times from production lines to the warehouse; and the
actual productivity of the plant and department verified.
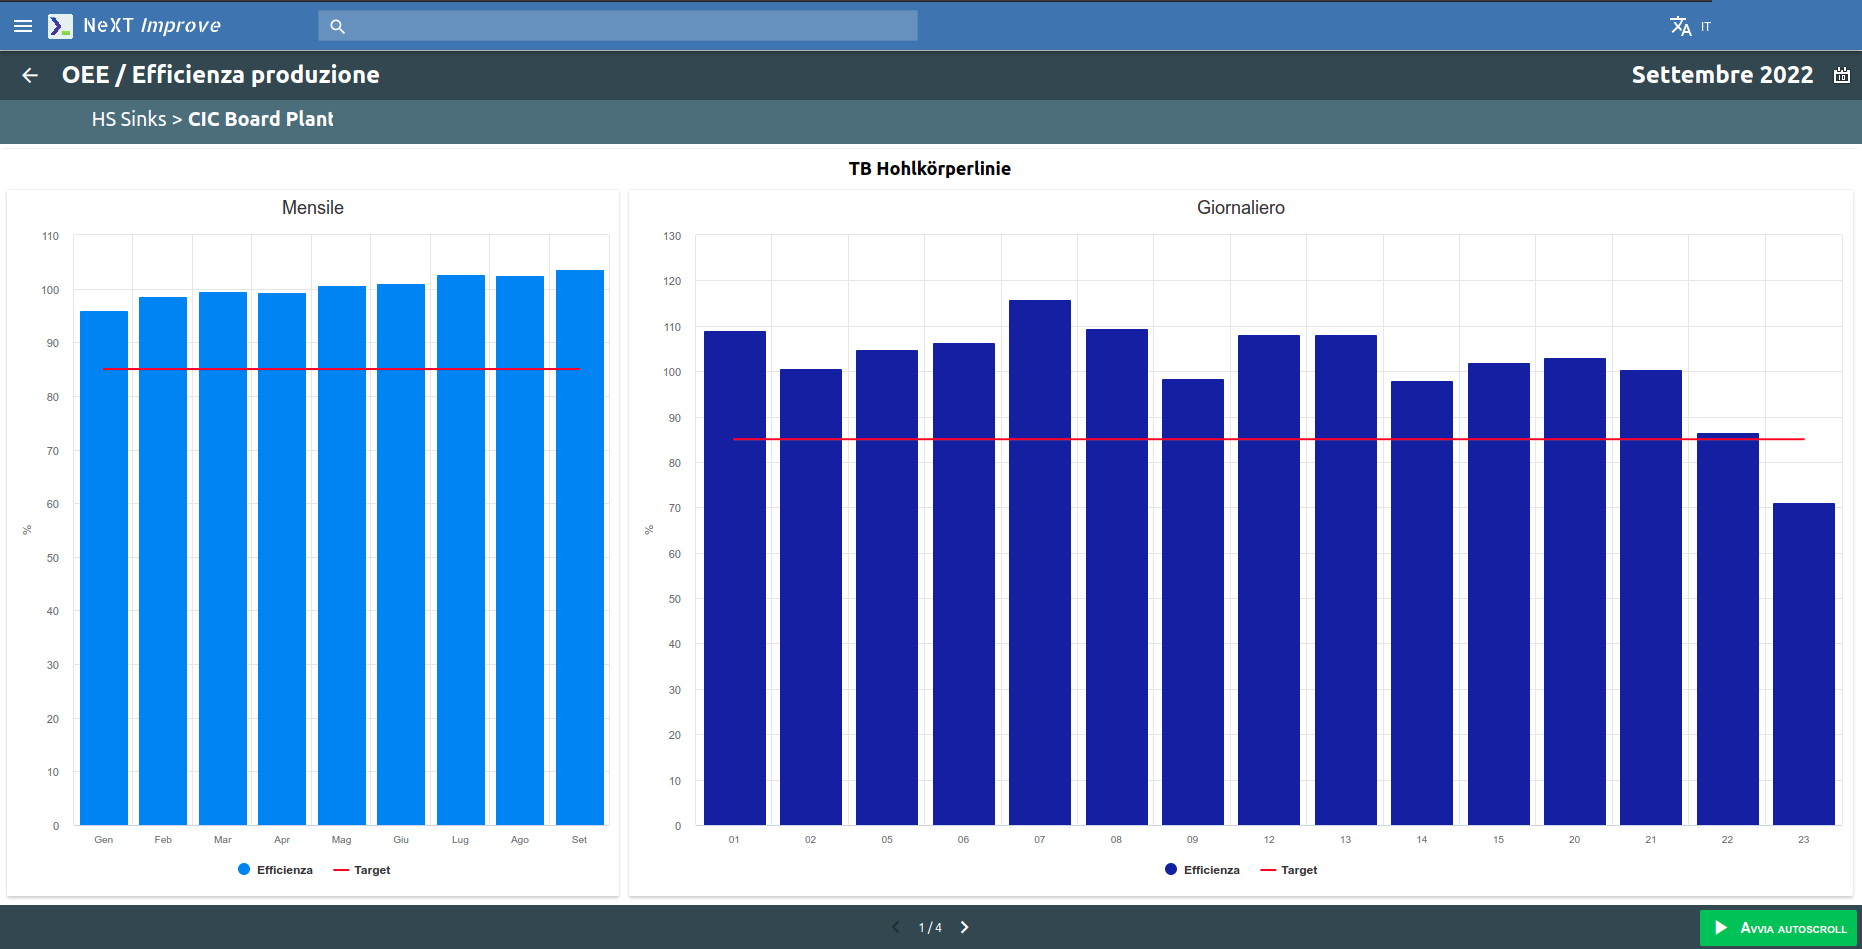
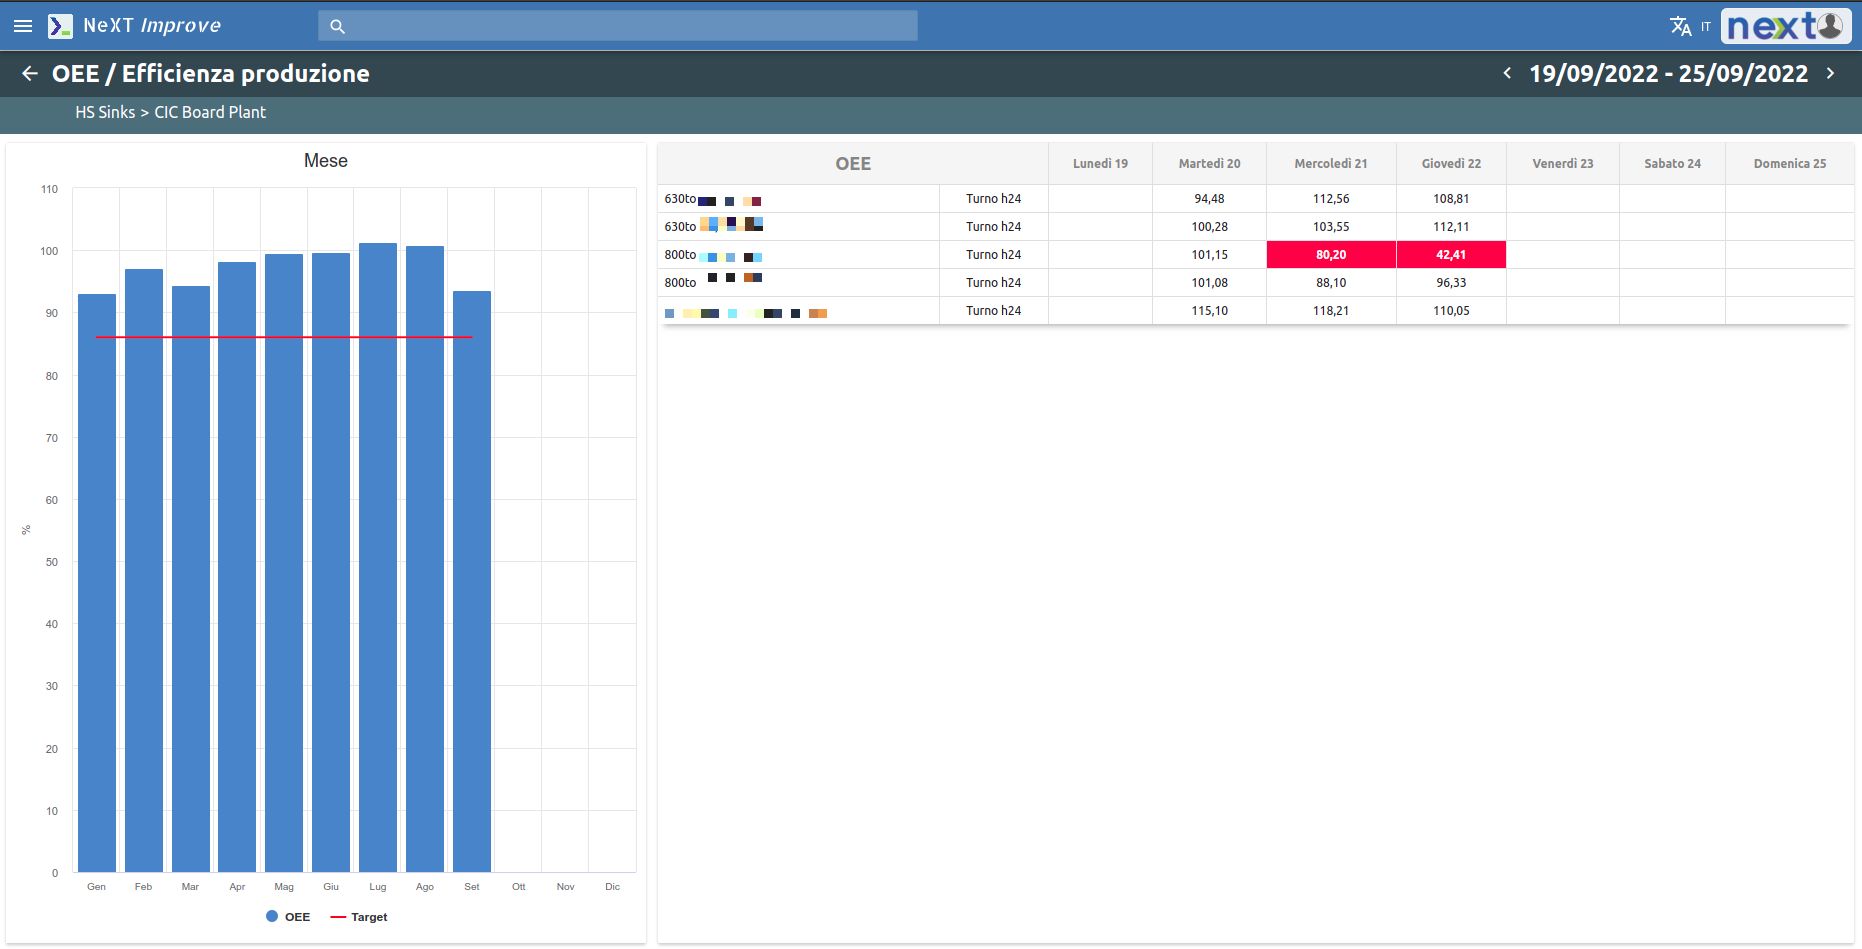
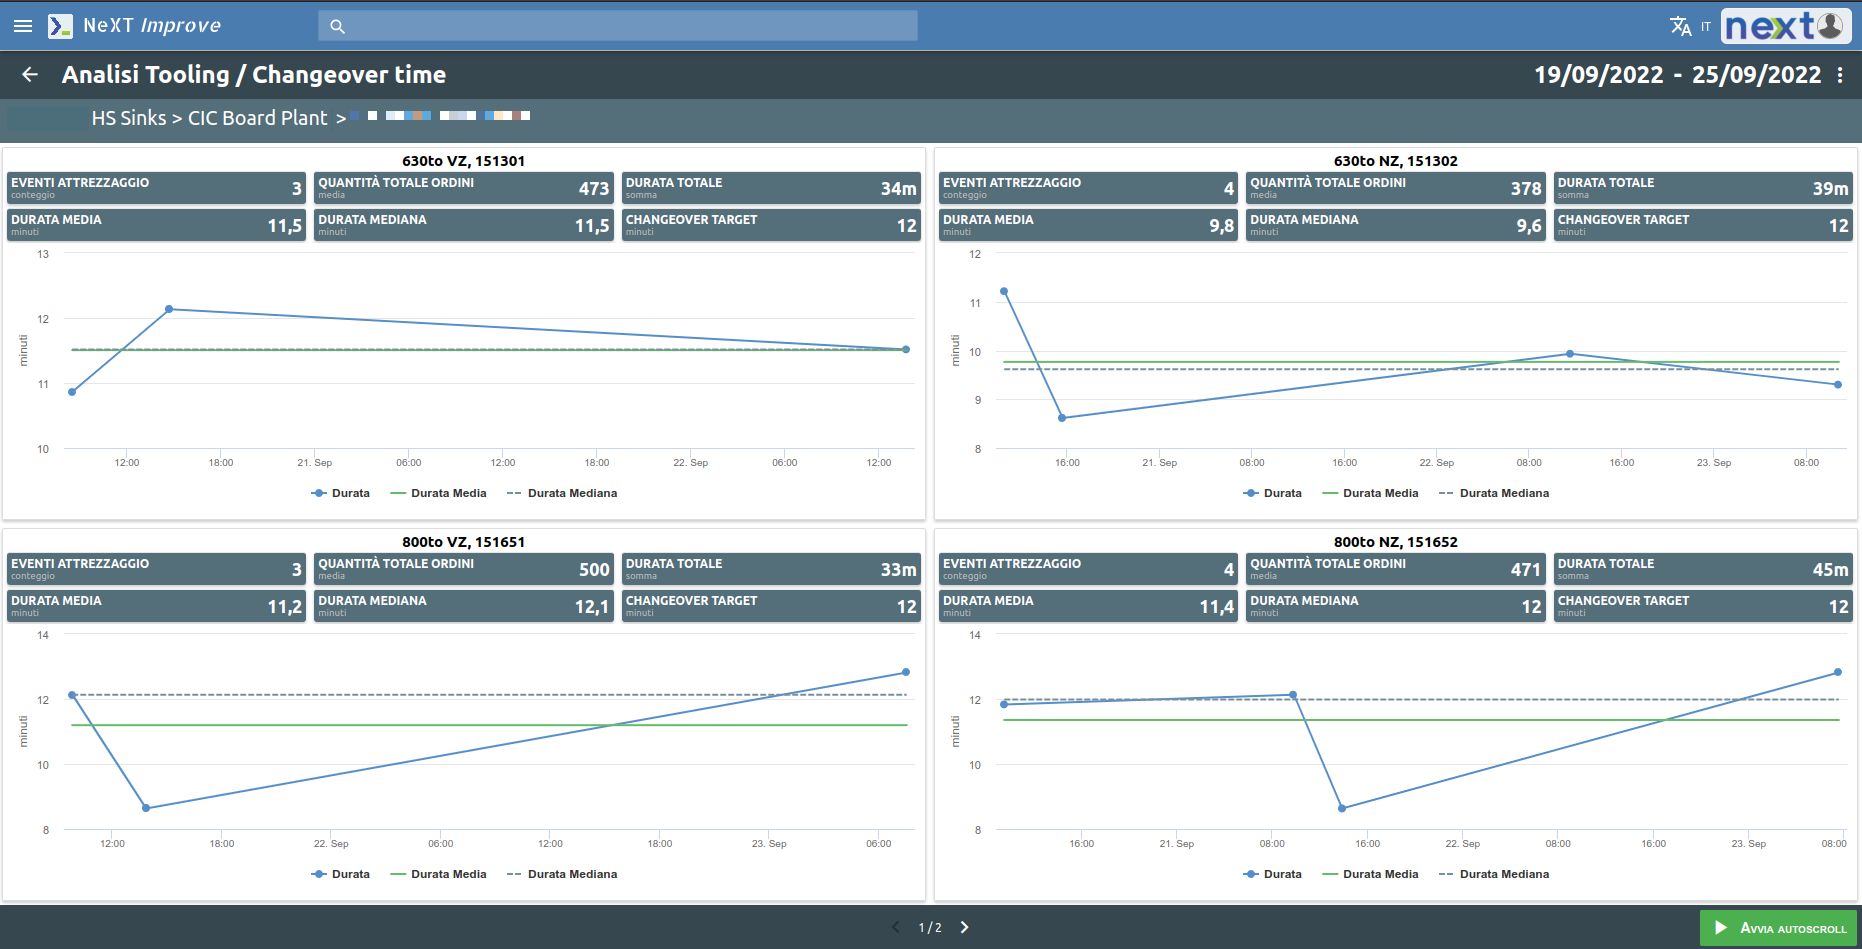
The Cost area can also integrate with any OEE System in production. The OEE produces data onefficiency, downtime and the time required to set up production changes (tooling).
Efficiency data can be collected either by month or by week and grouped by plant or by individual department and shift.
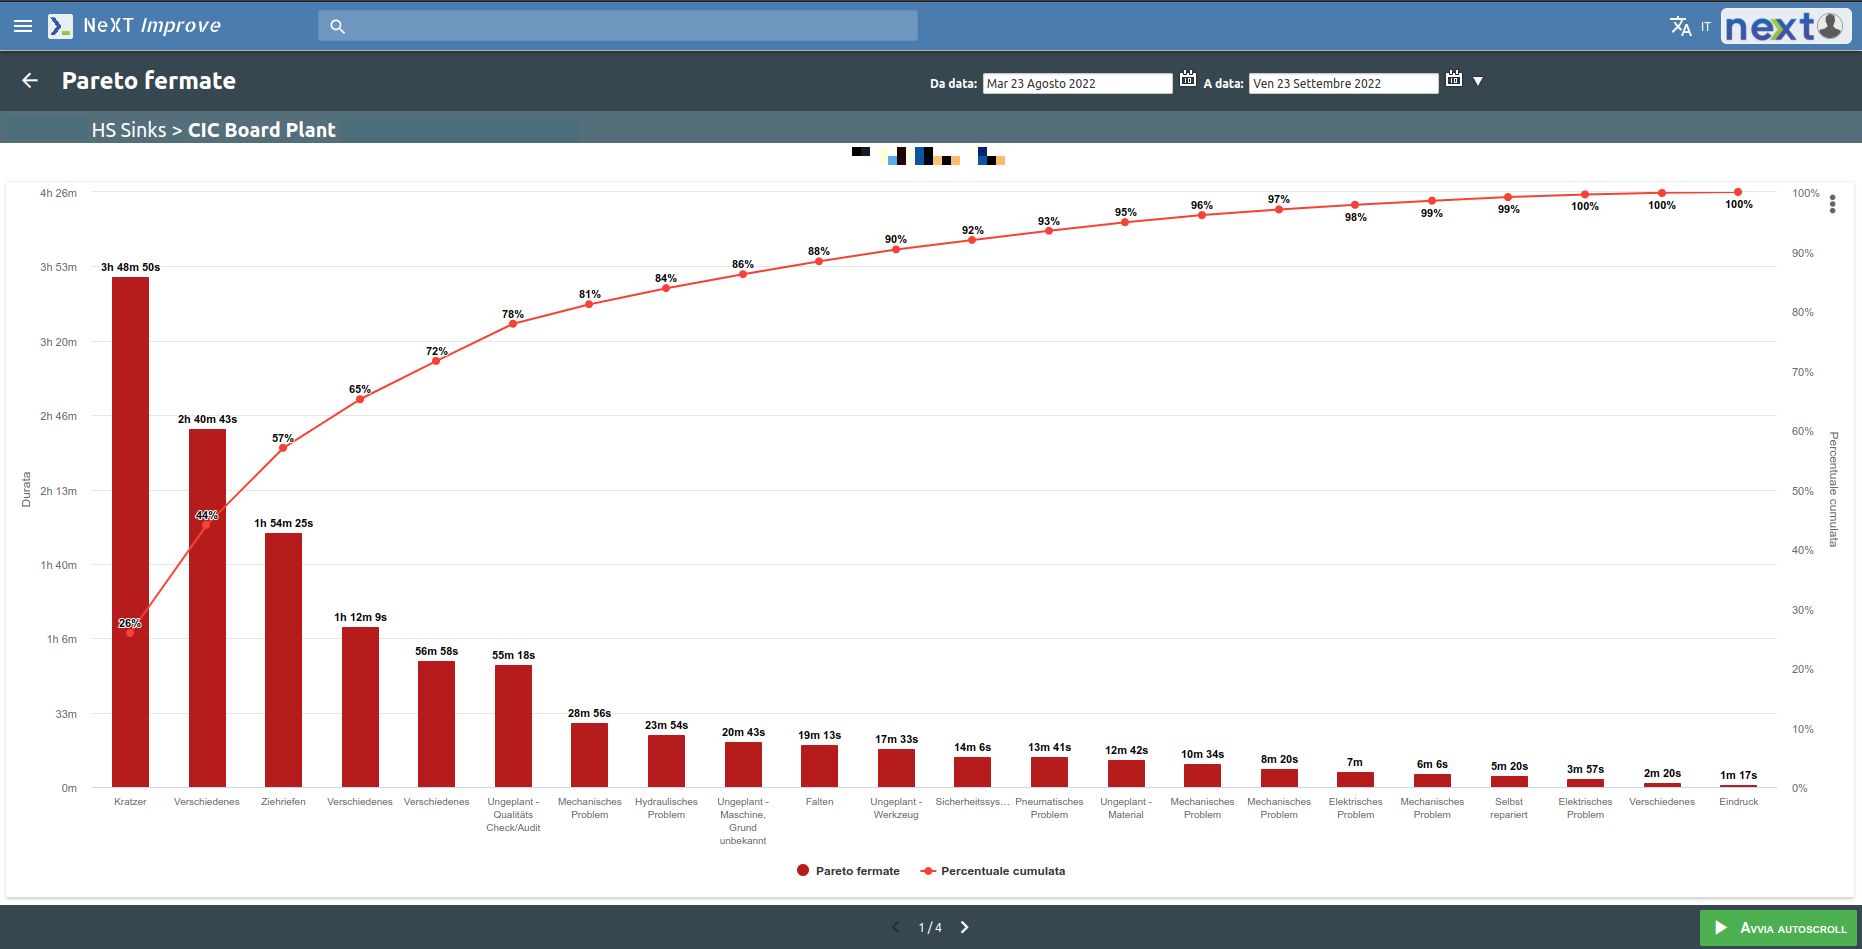
Downtime causes are shown and analyzed through a Pareto chart.
It is possible to set a threshold for the tooling time of a new production order and check what the actual trend is compared to what is desired.
Finally, delivery times (the pouring of produced parts from the production line to the warehouse) are quantified and the actual productivity compared with the desired productivity.
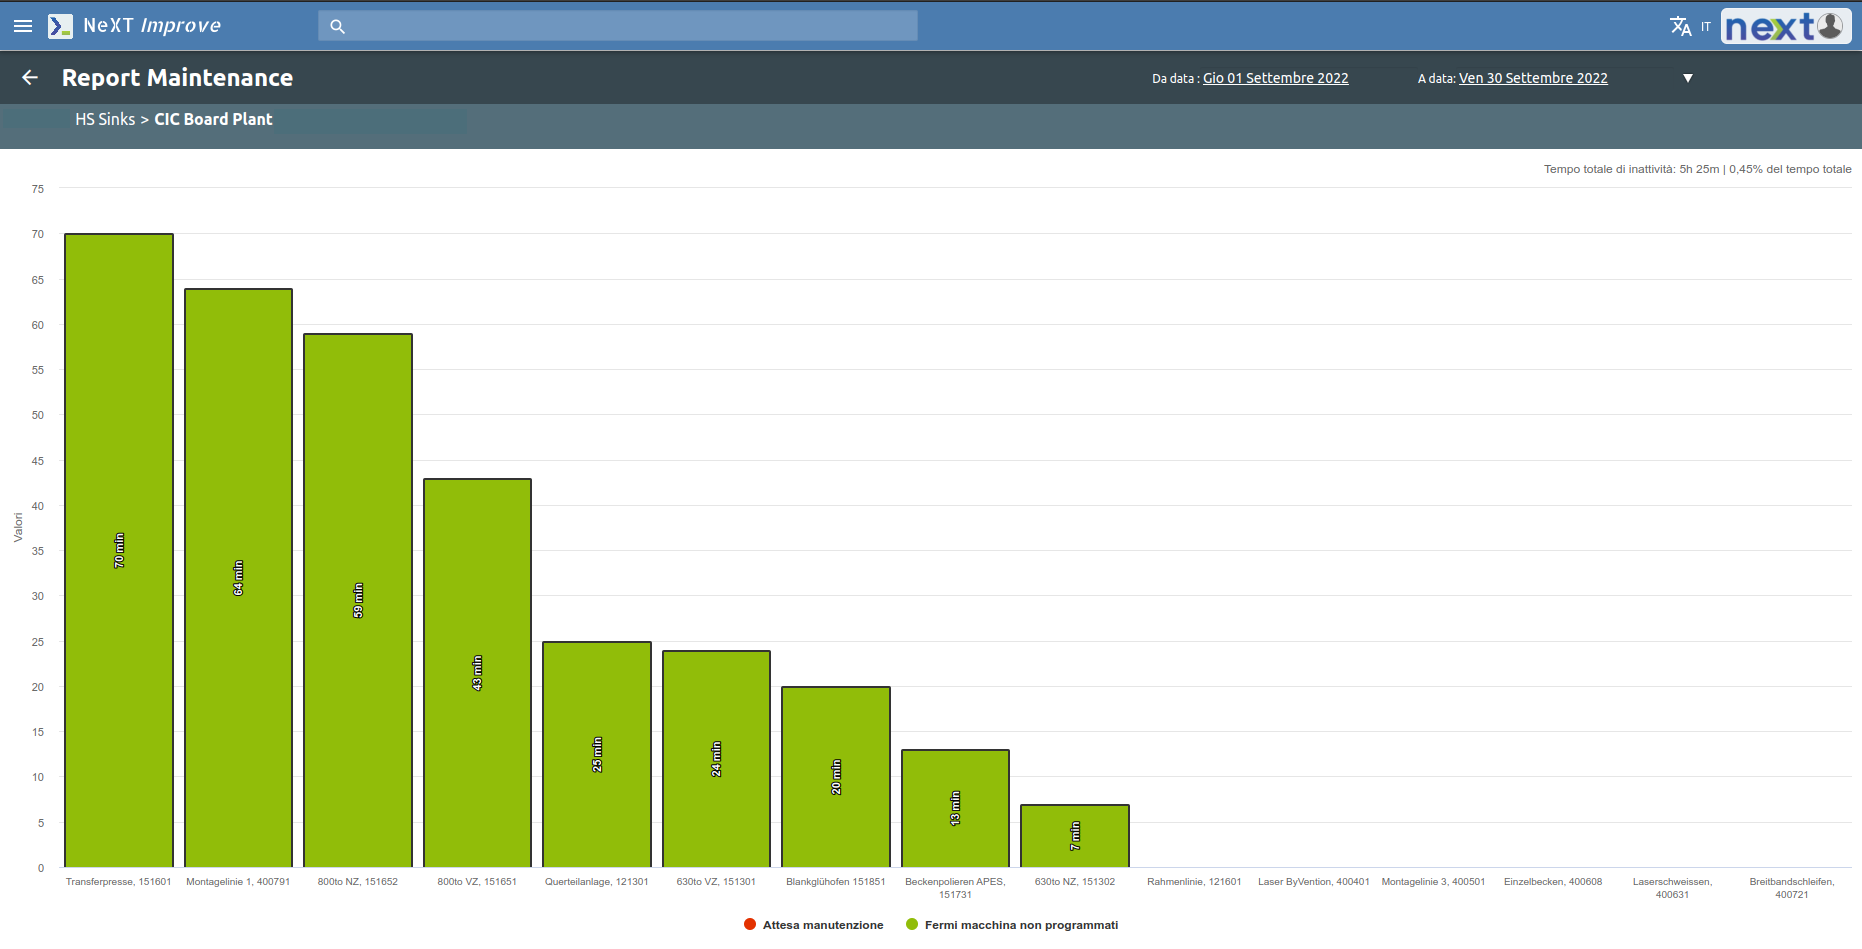
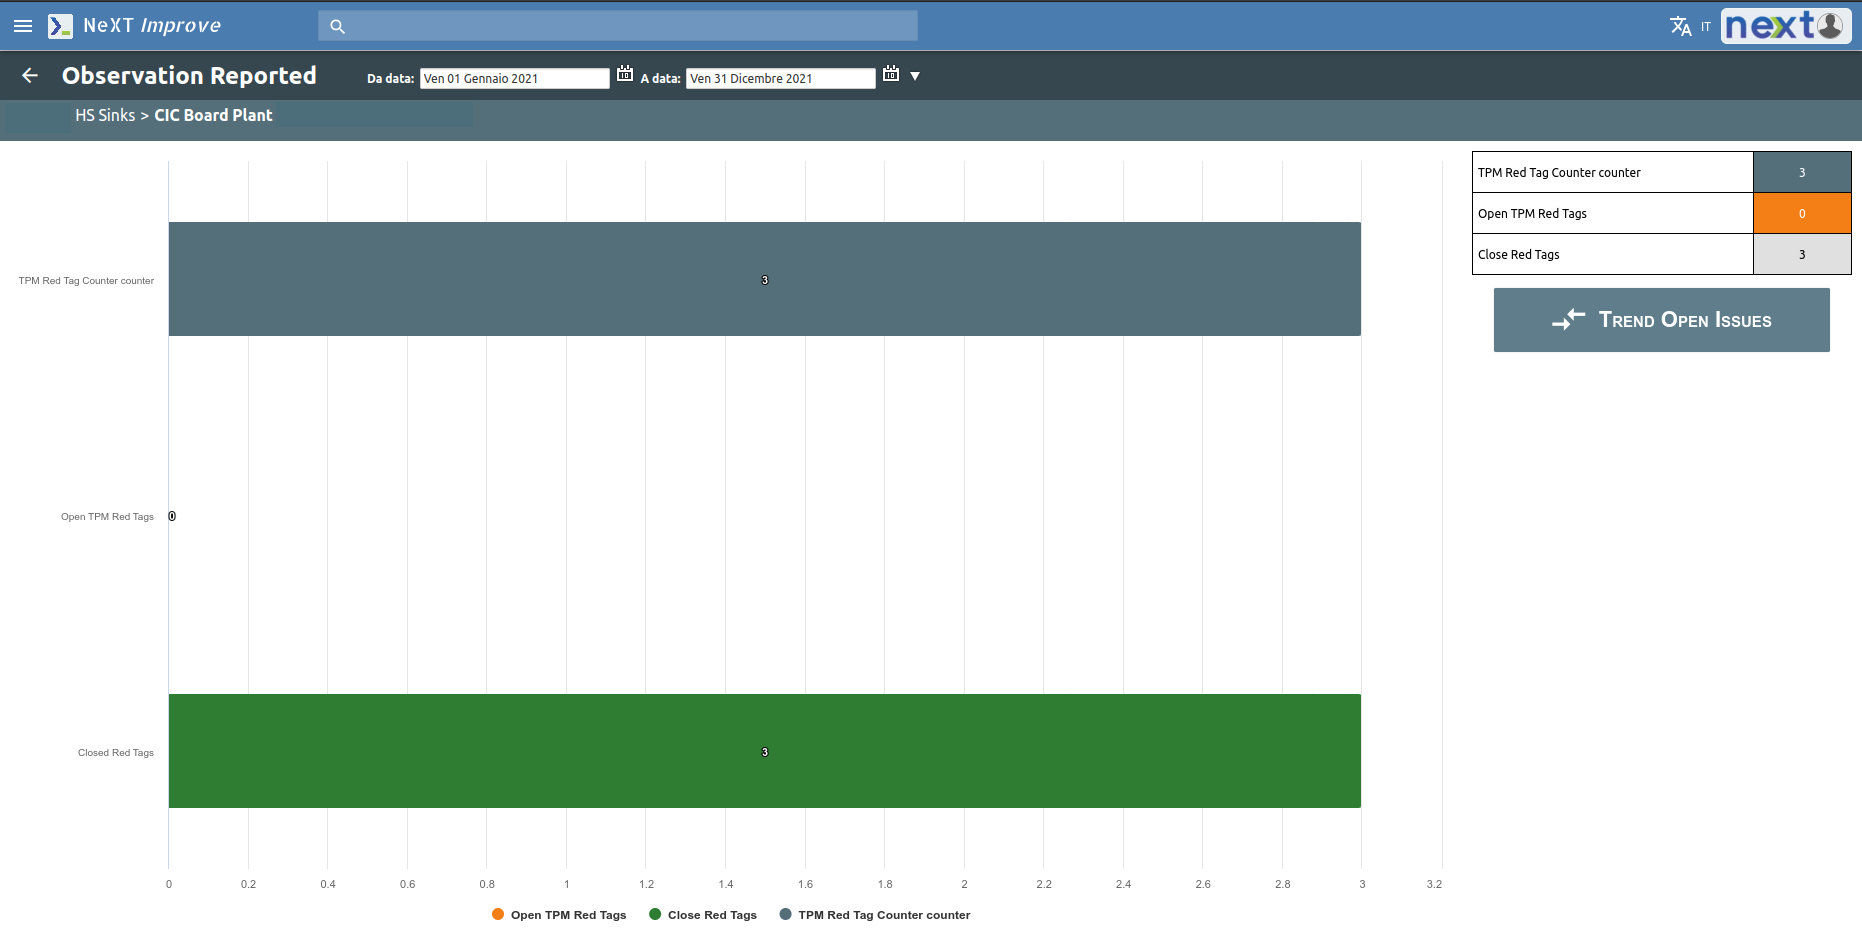
Maintenance
The objective of this area is to reduce the causes of sudden machine downtime as much as possible, by monitoring the main causes and giving the opportuinity, as is the case with the Safety area, to report via a mobile device any maintenance problem or potential maintenance problem.
First, through a histogram, the main causes of downtime are displayed and related to machine downtime.
Then, as with safety, it is possible to visualize a report of the opened tickets and the range between made tickets and open/closed problems can be viewed.
The Gemba Walk
The Gemba walk in the Lean production methodology represents the moment when one leaves the desk to “walk” and go to where value is generated.
By doing so, the manager can observe, interact, ask the whys, always empathizing with the work of his or her employees: we must focus on the process and not on the people.
The obvious goal is to track the various types of inefficiencies (MUDA).
How does the Gemba walk “work”?
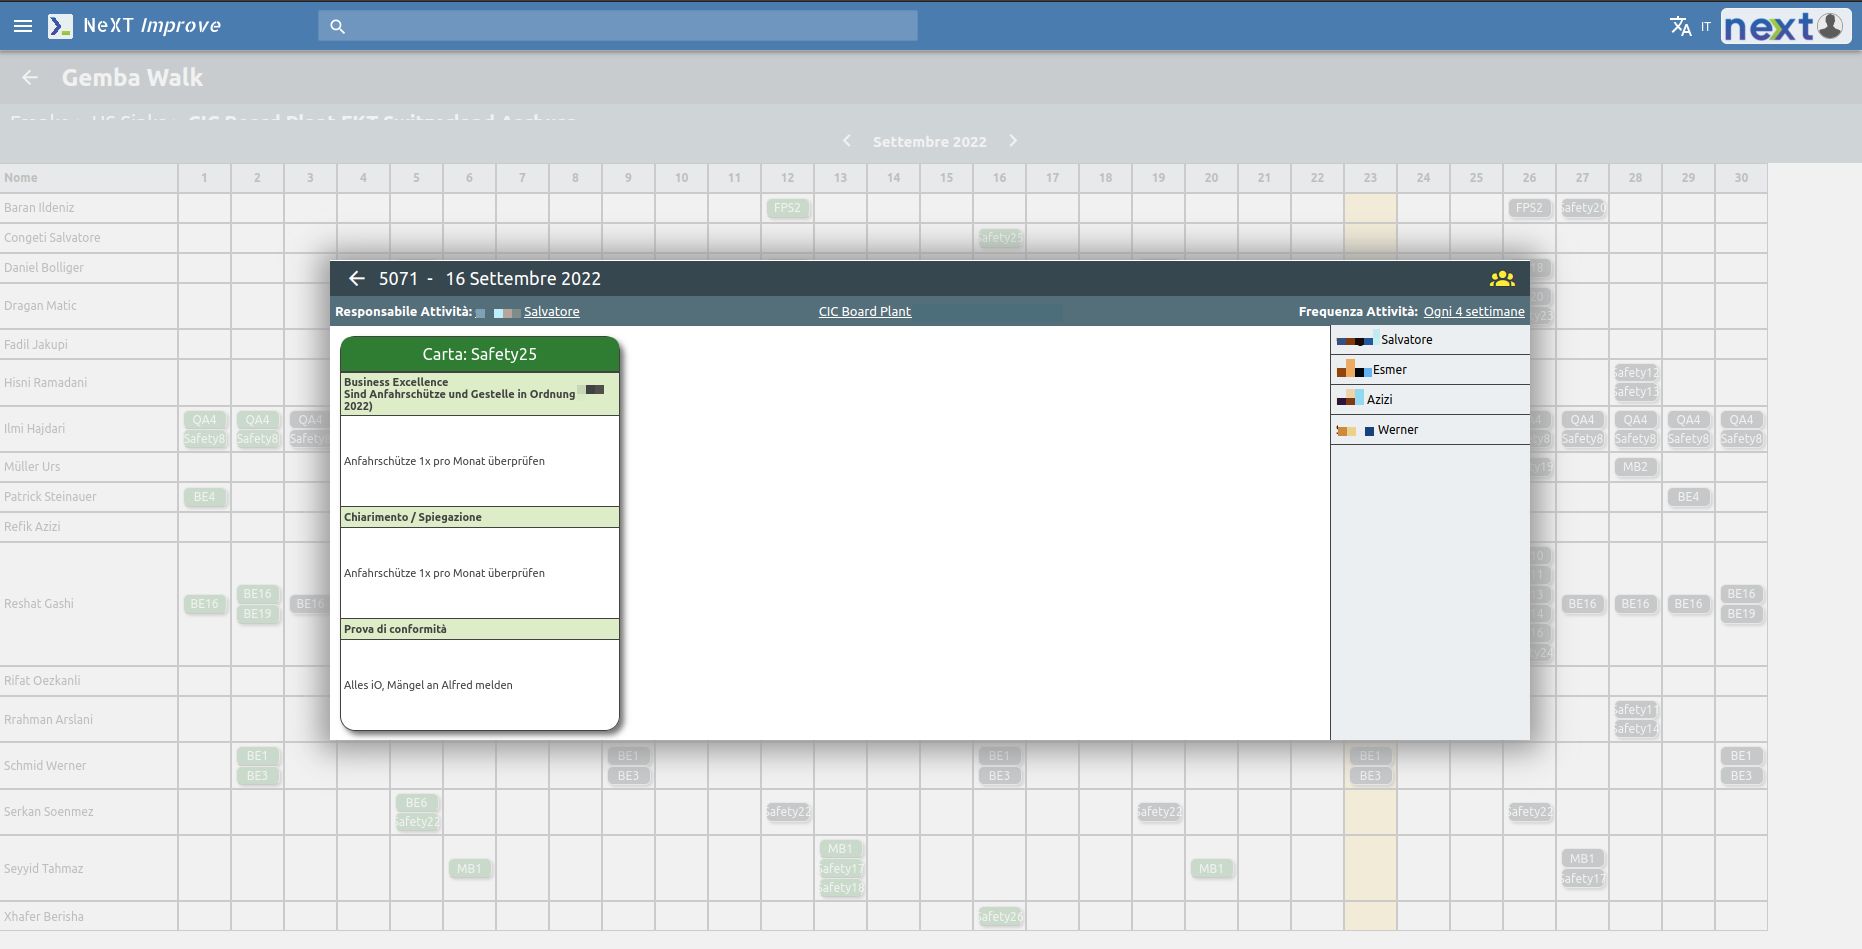
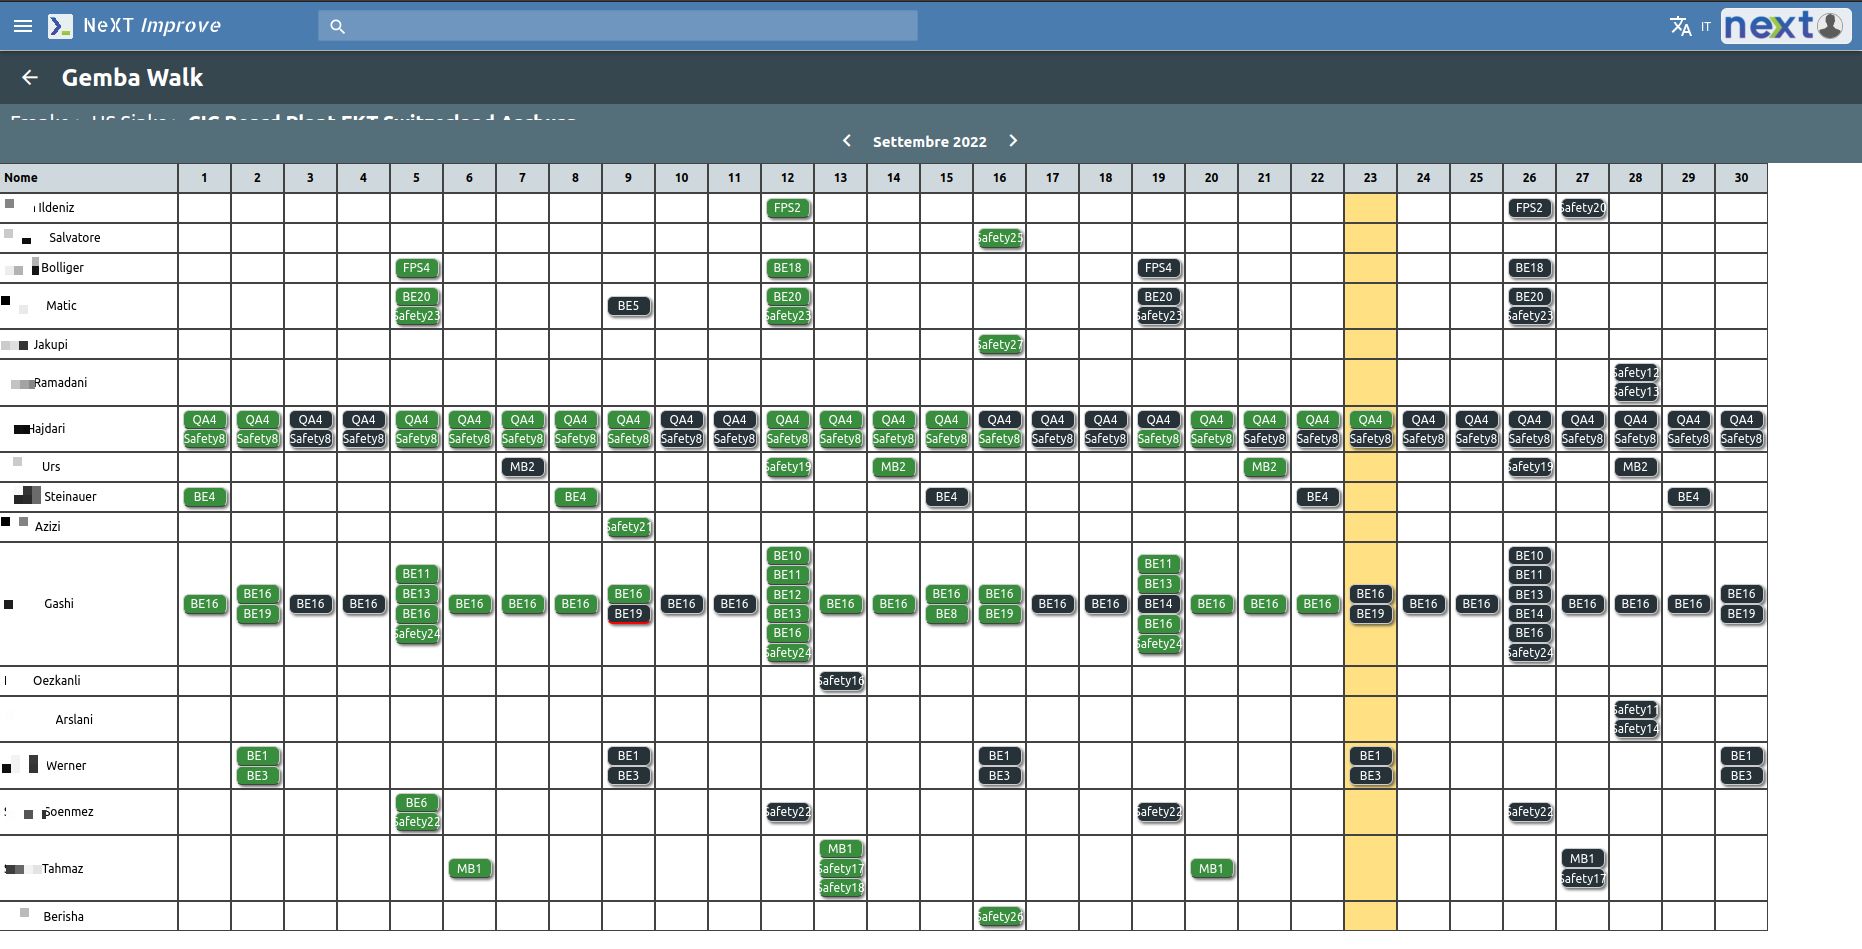
Digital Shopfloor Management’s Gemba walk uses a mobile device and works through a calendar and Cards.
Each card is specific to each of the 5 subject areas.
Each card provides for a manager and a team.
Each card will have a frequency and a time duration (e.g. «Once a week, for 3 months»)
The specific purpose of the cards is to verify that the requirements defined in them are met (es. «Verify that everyone is wearing safety equipment.»)
We develop software solutions to provide aggregated data dedicated to business management, supporting them in operational decisions.
The excellence of service quality is guaranteed by the agent type of programming and the strong emphasis we give to research and development.
Within its most advanced systems, NeXT solutions include the use of Artificial Intelligence and Machine Learning models.
© 2023 NeXT Srl Unipersonale - P.IVa. 02510420421 - Privacy and cookie information - Powered by Fuel31


