Energy consumption
monitoring
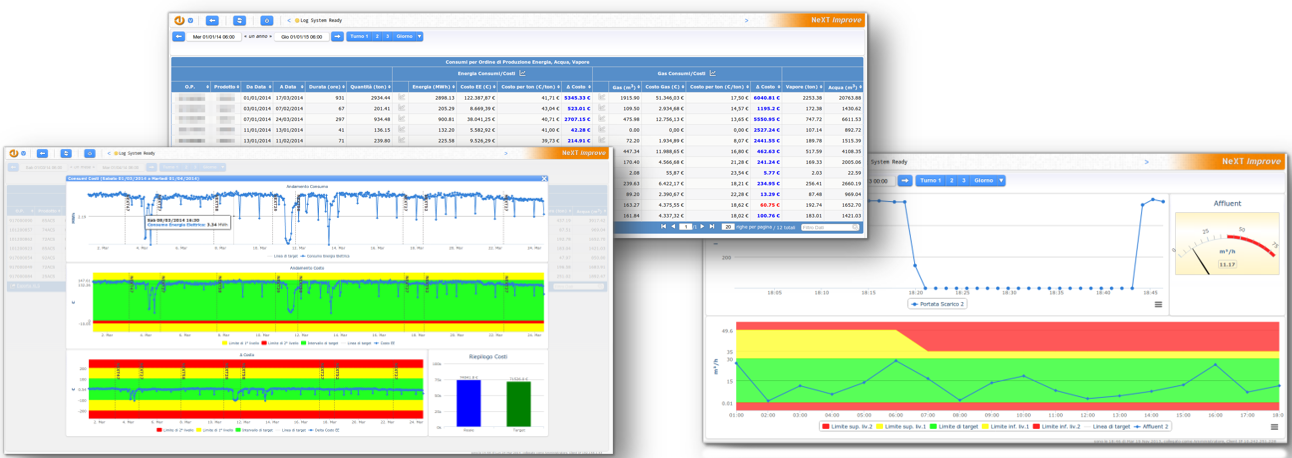
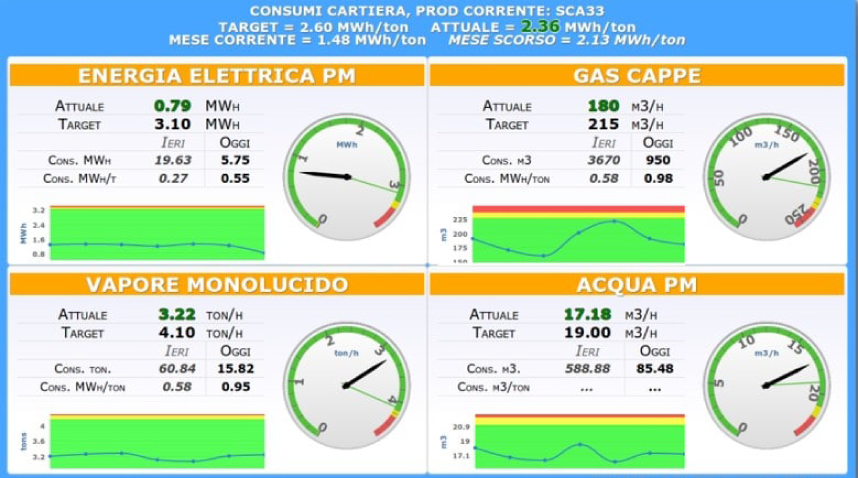
The constant monitoring of thousands of variables allows to work in order to reduce the energy and chemical consumption, all of this for the evaluation of the plant and the realization of a better system, in terms of resource consumption and environmental impact.
The workflow for monitoring the energy consumption
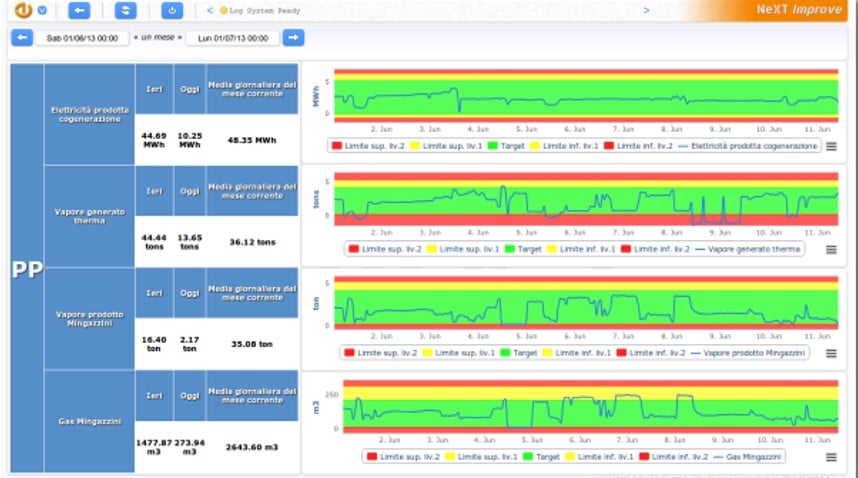
For each variable it is possible to draw up the control chart with its overtime values.
It’s going to be possible to visually verify the OOCs (out of controls).
Process Modelling
In this phase we can proceed to the configuration of systems and sub-systems and to the insertion of anagraphics and parametrization
Property Settings
Setting of the variable properties, of the type of control chart, of the specification limits domain
Data acquisition
Automatic acquisition of the data directly from the plant DCS, strictly connected to sensors located in critical points, highlighting the OOC variables
Control Chart definition
Definition of the advanced control charts which are a group of statistical models that allow to predict eventual shifts in comparison to reference values
Ready to… save money?
Evaluation of prime materials
The system IMPROVE 4.0 allows the quantitative and economic visualization of the prime material usage, as it’s able to trace the registration of the prime material since the supplier’s lot creation.
The monitoring of the energetic consumptions allows the precise calculation of the energetic costs of each order.
“If you add a little to a little, and then do it again, soon that little shall be much.”
Ready to… save money?
© 2023 NeXT Srl Unipersonale - P.IVa. 02510420421 - Privacy and cookie information - Powered by Fuel31
