SPC – Statistical Process Control
The Statistical Process Control (SPC) aims to understand and analyze the variability of a process.
It is the “smartest” part of a digitization process:
it is HERE that it can be used in a really effective and powerful way…
Artificial Intelligence.
What is Statistical Process Control?
It is the application of statistical techniques to understand and analyze the variability of a process
[Joseph M. Juran]
In order to apply these techniques, it is necessary to first configure the variables and then acquire the values.
Configuration of the variables
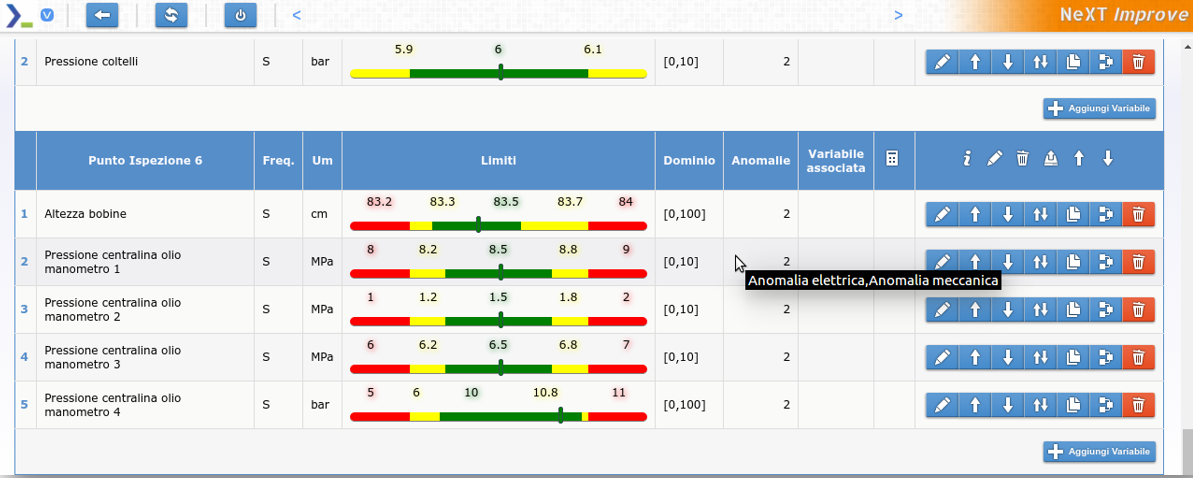
In a first step, the variables are configured, determining what the acceptable deviation should be for a given value.
Statistical Techniques
Main statistical techniques that can be used in SPC methodology:
Pareto charts
Control charts
Cause-effect diagrams
Action Plan
Ready to… improve your processes?
Configuring variables
The process manager can define the variables of the control charts, i.e. define the concept of out of control.
The possible fluctuations of each variable are indicated by colors. These correspond to the different suitability of the parameters set by the process manager.
Red zones indicate negative values that affect product quality or other aspects of the production process.


Statistical techniques
For each variable it is possible to draw up a control chart with its values over time. It will therefore be possible to visually verify any out-of-control values.
After having created the control charts, we will proceed to define the causes of out of control and the flow of corrective actions: one of these tools is the OCAP (Out of Control Action Plan), a flow chart that contains the series of operations to be followed in order to manage an out of control.
With the help of the Pareto diagram, we will be able to identify the causes that have the greatest impact on the phenomenon in question and, therefore, to evaluate on an objective basis the priorities for intervention in solving the problems.
Finally, the diagram of cause/effect (or diagram of Ishikawa) is used like an instrument in order to characterize the causes, so the relations between one characteristic and its factors, and therefore the solution of the problem.
"If you torture the numbers long enough, they'll confess to anything."
Ready to… improve your processes?
© 2023 NeXT Srl Unipersonale - P.IVa. 02510420421 - Privacy and cookie information - Powered by Fuel31


