With this episode we’ll start a journey going back through experiences in order to find out, step by step, how we could improve our machines (production), thanks to the progressive digitization of the processes.
All of that until we reach the “Smart factory”.
Why is it so crucial to initialize a digitization process?
The answer is as simple as articulated:
- Access simplicity to the necessary tools dedicated to measure the progresses and lacks of a company (KPI)
- Drastic reduction of the waster in all the processes involved into production
- Positive impact on the environment and nature thanks to the electric energy reduction and waste reduction
We’ll find out that this transaction is not as drastic or as expensive as you may think.
In order to understand it deeply it’d be good to make a step-back and imagine a machine entirely short of intelligence (which you’d probably find in today’s factories).
In the following episodes of the Smart Factory Blog we’re going to digitize a machine, making it smarter and smarter.
By doing that, we’ll be able to appreciate which are the real efforts when it comes to realize a smart factory.
On each episode you’ll find a TOOLBOX, which indicates all the strictly necessary components to implement what we’ll have explained..
More than that, we’ll find out WHY it is crucial to follow that path and make the change.
Let’s start then. Enjoy!
First upgrade: The machine starts counting
The first thing we may want a “silly” machine to do is to count.
What should we count you’d say: we count the produced pieces.
All of that is possible by covering the entire production line with sensors, connecting them to a PLC
Basics: What is a PLC?
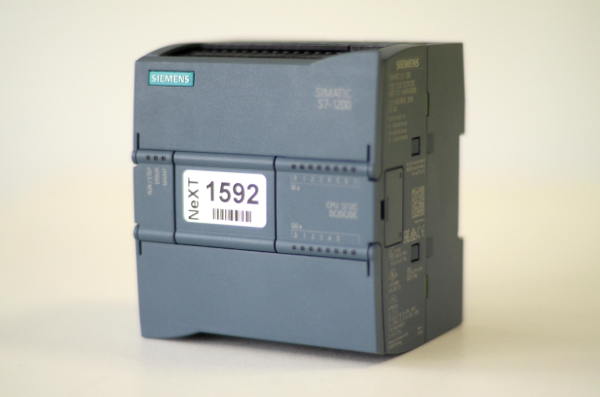
The PLC
The PLC is a small computer designed for handling, managing and controlling of the industrial processes. The main purpose is to elaborate the digital and analog signals coming from the sensors and headed to the actuators in the industrial plant.
Depending on how the PLC is programmed it may execute various functions: counting the pieces (as we already said) is the most basic one.
The story doesn’t end here: it’s also capable of counting the breakdowns and, in some cases, register the reasons of those breakdowns.
A PLC is a serious, non-expensive upgrade that doesn’t even require huge effort to setup and it gives crucial KPIs. Let’s remind them:
- Nr of produced items
- Nr of breakdowns
- Breakdown causes
The analysis of this problem deserves to go deeper, because the machine breakdowns are considered the most important causes of production losses. A broke machine has absolutely zero purposes.
The breakdowns and the concept of availability of the machine
The concept of availability of the machine perfectly describes its ability of working during the timeshifts (obviously excluding the planned pauses).
During this time, the machine does not always work: the reasons may come from different aspects, but the data that we mostly care about is the time loss.
Another upgrade of the machine may be the ability to count the amount of breakdowns. Turns out the PLC is particularly helpful to do that, but to be extremely detailed, it’d be better to have an HMI (human machine interface) where the operator manually indicates the causes of each breakdown.
The machine breakdown is such a nightmare for any plant manager: it’s considered the biggest waste that drags down the efficiency, as it brings other wastes and problems. The production line flow has to be continuous and it’s not expected for it to stop. This problem involves the operators to take care of the failure, the missed production and the resources used to repair the machines.
Deepdown in the machine breakdown
When could we say a machine is efficient?
We may say this:
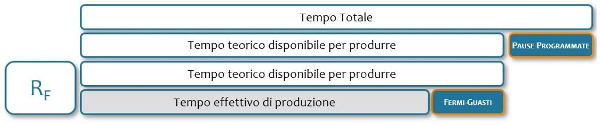
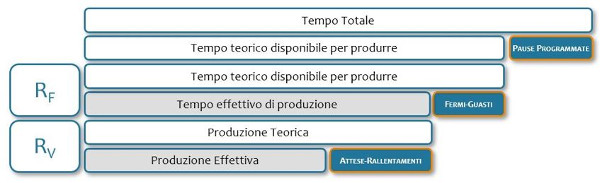
“Let’s consider a theoretical available to produce time “t1”.
T1 is the resulting of the Total Time from which all the planned pauses are subtracted (they have nothing to do with failures).
Even if t1 is a time without the planned stops, it’s not an effective time. It’s a theoretical time, in which in theory, the machine is available.
It’d be interasting to understand which is the effective production time, which consists in the remaining time in case we subtract the unpredicted stops.
The effective production time is then:
T1=d-f
Where “d” is the theoretical time to produce (ex. 1hr,8hr,1 week…) and “f” is the time occupied by stops and faliures.
The production performance
It it possible to express the value of the “efficiency of the stops” (RF) with a percentage like so:
RF= (d-f)/d %
In absence of those stops, the result would be 1, so it’d be 100%. Otherwise, the result’d be a lower value (for example 90%).
Once we obtained the efficiency value (related to the effective availability of the machine) “RF”, it’ll be easy to know the value of the efficiency loss due to the stops “PF”. That value will be particularly useful in order to understand the weight of this parameter on the OEE (that we’ll see shortly). The formula to express that value is really straight forward:
PF= 1-RF
Second Upgrade: The machine understands “why”
We just said that a PLC may understand the causes of eventual machine breakdowns (but not all of them).
Therefore, a further upgrade of the machine, would be the one that allows us to understand all the possible causes of machine breakdowns. We may reach that objective by connecting an HMI (Human Machine Interface) station.
It involves a small touchscreen through which the operator will be able to notify:
- Various kinds of stops (sudden or organizational) and the related cause
- Problems related to the quality of the piece
- Beginning and ending of the tooling phase of a new production (through which the machine is not working)
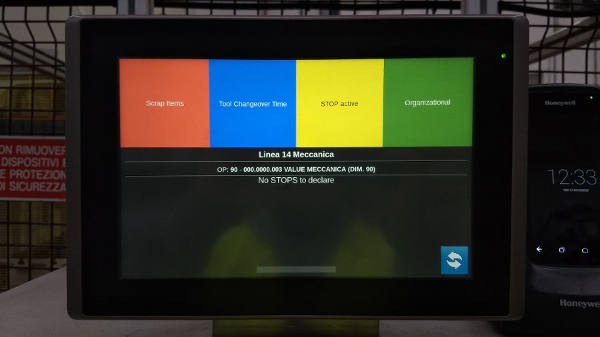
Human-Machine Interface
The Flow-Speed: how much it performs
How am I performing whenever I (operator) can work? Which is the gap between produced pieces and expected ones? Which are the reasons for those gaps? During the effective time of production we may do so, but it’d be a theoretical production. The one we should know would be the effective production.
Scraps
A lack of efficiency in speed could represent an alarm for various problems of different nature: upstream or downstream, microstops, organizational or supplying problems. All of those reasons can be registered by the operator through the HMI. In order to calculate the performance level of the productive flow we need to know the amount of produced pieces (we know that value because we transformed the machine in a smart one with our PLC) and a value, that we decide, which represents the interval through which each product can be released. This value is named Takt Time. Now we have all we need. It’ll be enough to multiply the number of pieces and the takt time and divide all of that for the effective time to produce.
RV = (N. RQ = (N. PRODUCED PIECES – SCRAPS) / N.PRODUCED PIECES x takt time) / d – f
Therefore, the loss due to lack of speed will be extracted with the following formula:
PV = RF (1 – RV)
Quality problems
The HMI workplace (already used to casualize the machine breakdowns) can be used also to register the number of scraps and the related causes.
The quality problems may cause re-works or repairs that translate to time and resources loss. Alternatively they become trash, that converts in pollution.
The presence of scraps reduces even more the efficiency of the effective production, reducing it to the one that we may call compliant production which is what gets effectively produced from our old machine.
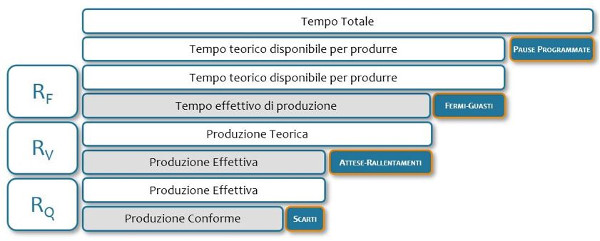
The scraps
The RQ value (how efficient is the quality of our products) relies on values that we already know thanks to that PLC that we installed in our old machine: the amount of produces pieces together with the number of scraps. The formula is the usual one:
RQ = (N. PRODUCED PIECES – SCRAPS) / N.PRODUCED PIECES
In absence of scraps, the result will be 1 (100%).
The loss caused by quality problems will be “PQ” and it’s calculated with the following formula:
PQ = RF x RV (1-RQ)
The OEE
All the data we registered through the PLC and the HMI workplace, may, or better, must be structured in something intelligible.
Al that data that we’ve been able to retain through the PLC and the HMI workplace, may, or better, they must be structured in something intelligible.
Once acquired they’ll be sent to a server through which software agents operate in order to rework them and send them back as reports and GUIs: we’re talking about the OEE module.
In order to calculate the OEE, we divide data in three crucial themes: RF (Breakdown performance), RV (Speed performance) and RF (Quality performance)
The Overall Equipment Effectiveness is a value expressed in percentages that we obtain by multiplying those 3 factors we just saw. Assuming that those three factors reach perfection, we’d obtain an OEE of 100%, in alternative, the sum of the OEE and the respective losses should result 100%.
For each time unit (hour, day, week, month) we can see how good each factor performed, which means how much each factor had impact on the missed 100%. The important thing is that now we know where to intervene in order to improve the efficiency of the entire process, covering all the problems one by one, depending on the urgency.
The Pareto graphs help us understand the breakdown causes and the quality ones.
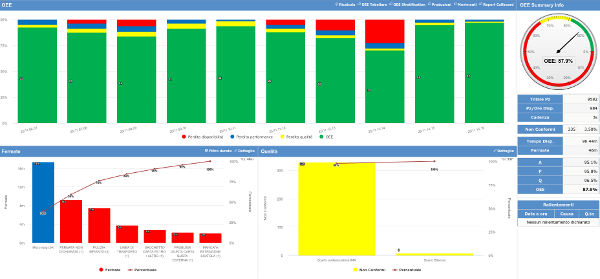
Overall Equipment Effectiveness
Let’s make a resume of what we said by creating a “toolbox” useful to reach that digitization level and consequently, of productive efficiency.
TOOLBOX:
– PLC
– HMI INTERFACE PER WORKPLACE
– OEE MODULE
We will definitely continue this digitization process in the following episode. Stay tuned!
If you’re interested in the themes that we’re covering, follow and text us on Linkedin: we’d like to know YOUR opinion
You may want to use something even quicker, in that case, follow us on Telegram!


Recent Comments